
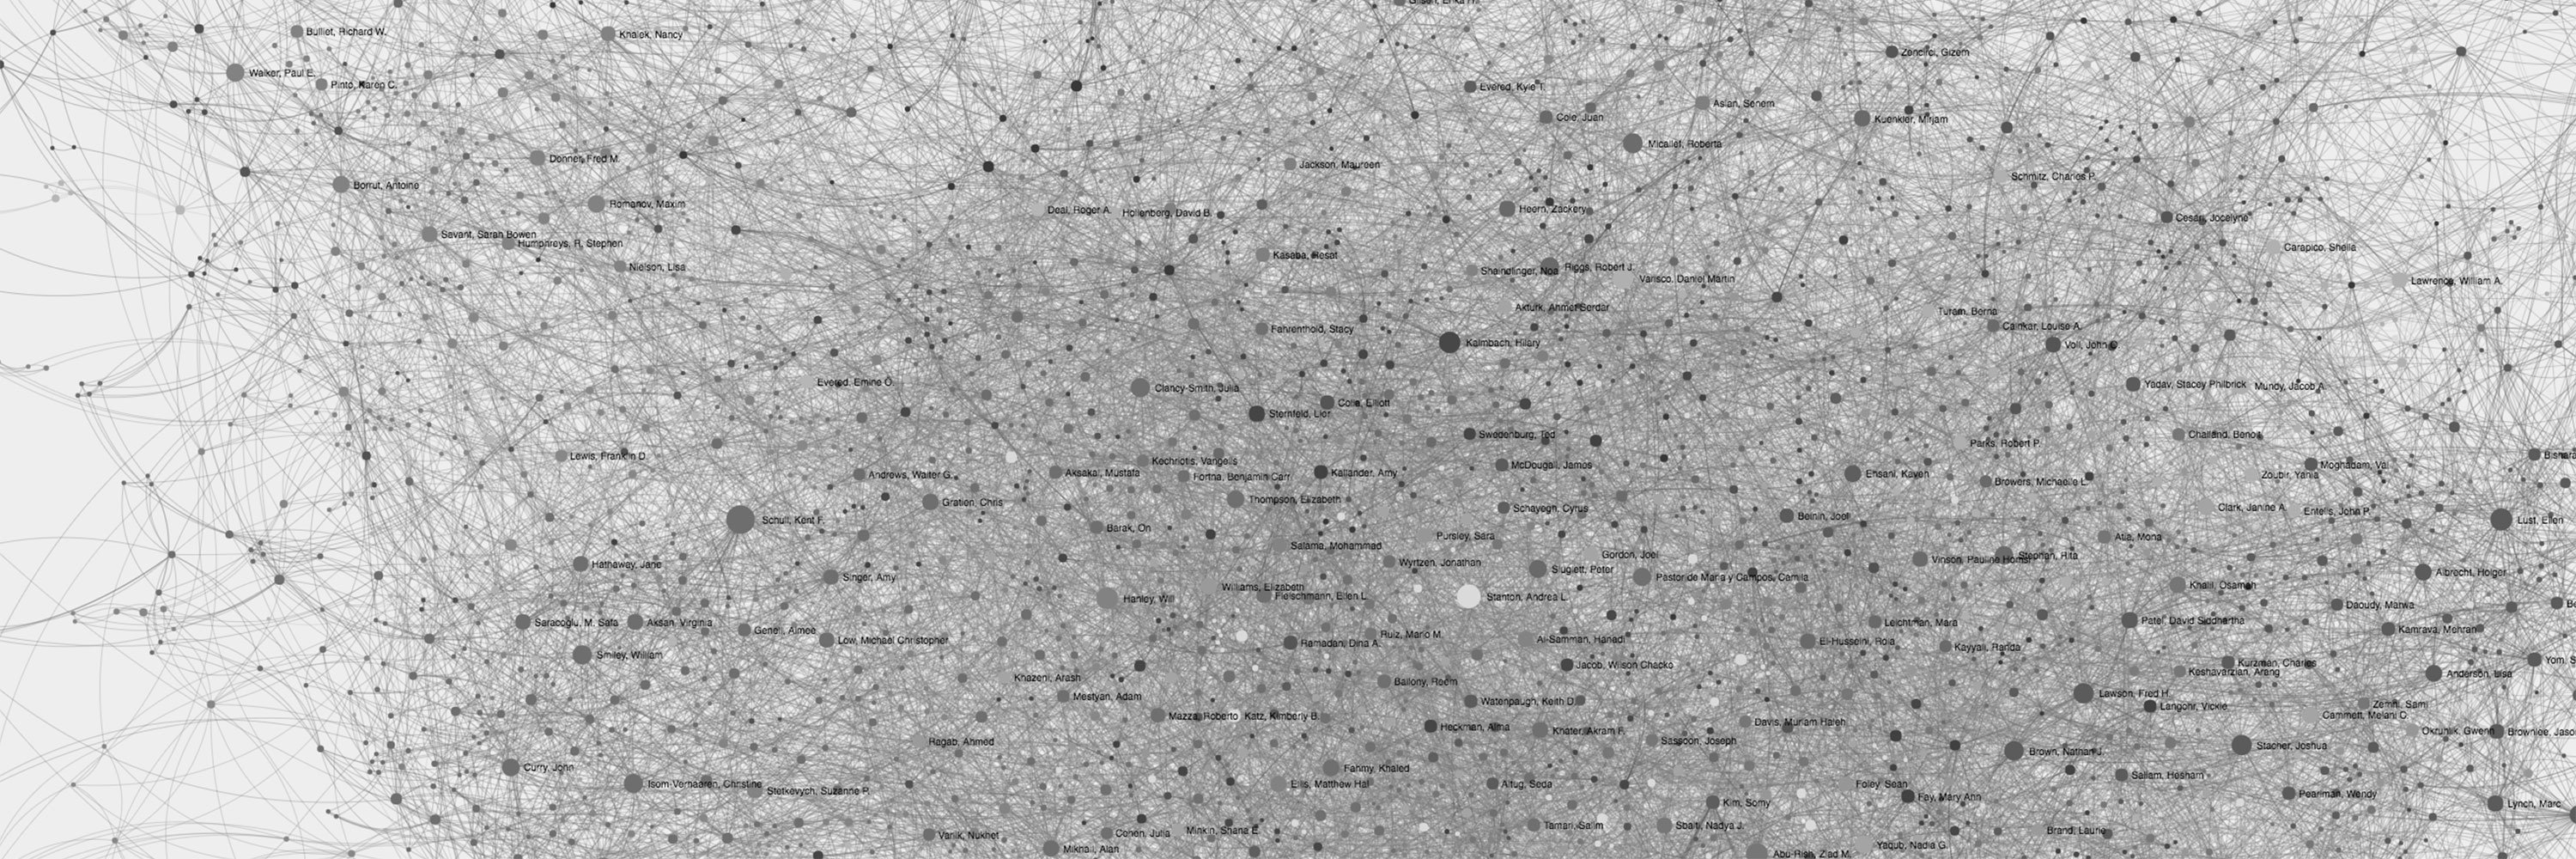
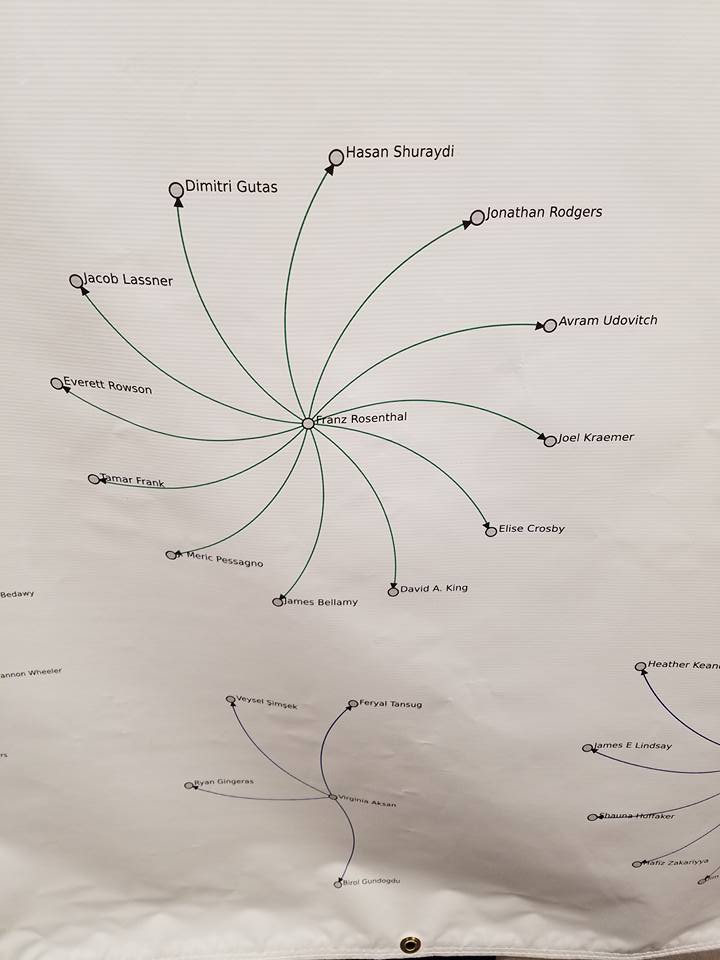
The Middle East Studies Association (MESA) celebrated its 50th anniversary last year. Although it is not as large as such associations as AAR and AHA, it is very dear to most of us who are engaged in the study of Middle East. Those who attended the annual meeting in Boston must have seen an attempt to visualize academic genealogies of scholars of Middle East, which sounds like a very interesting idea, but will take forever to realize. At the moment the genealogy looks like unconnected snowflakes (here is Franz Rosenthal's snowflake of students),1 but we all realize that the real life is way more complicated and more interesting than that (
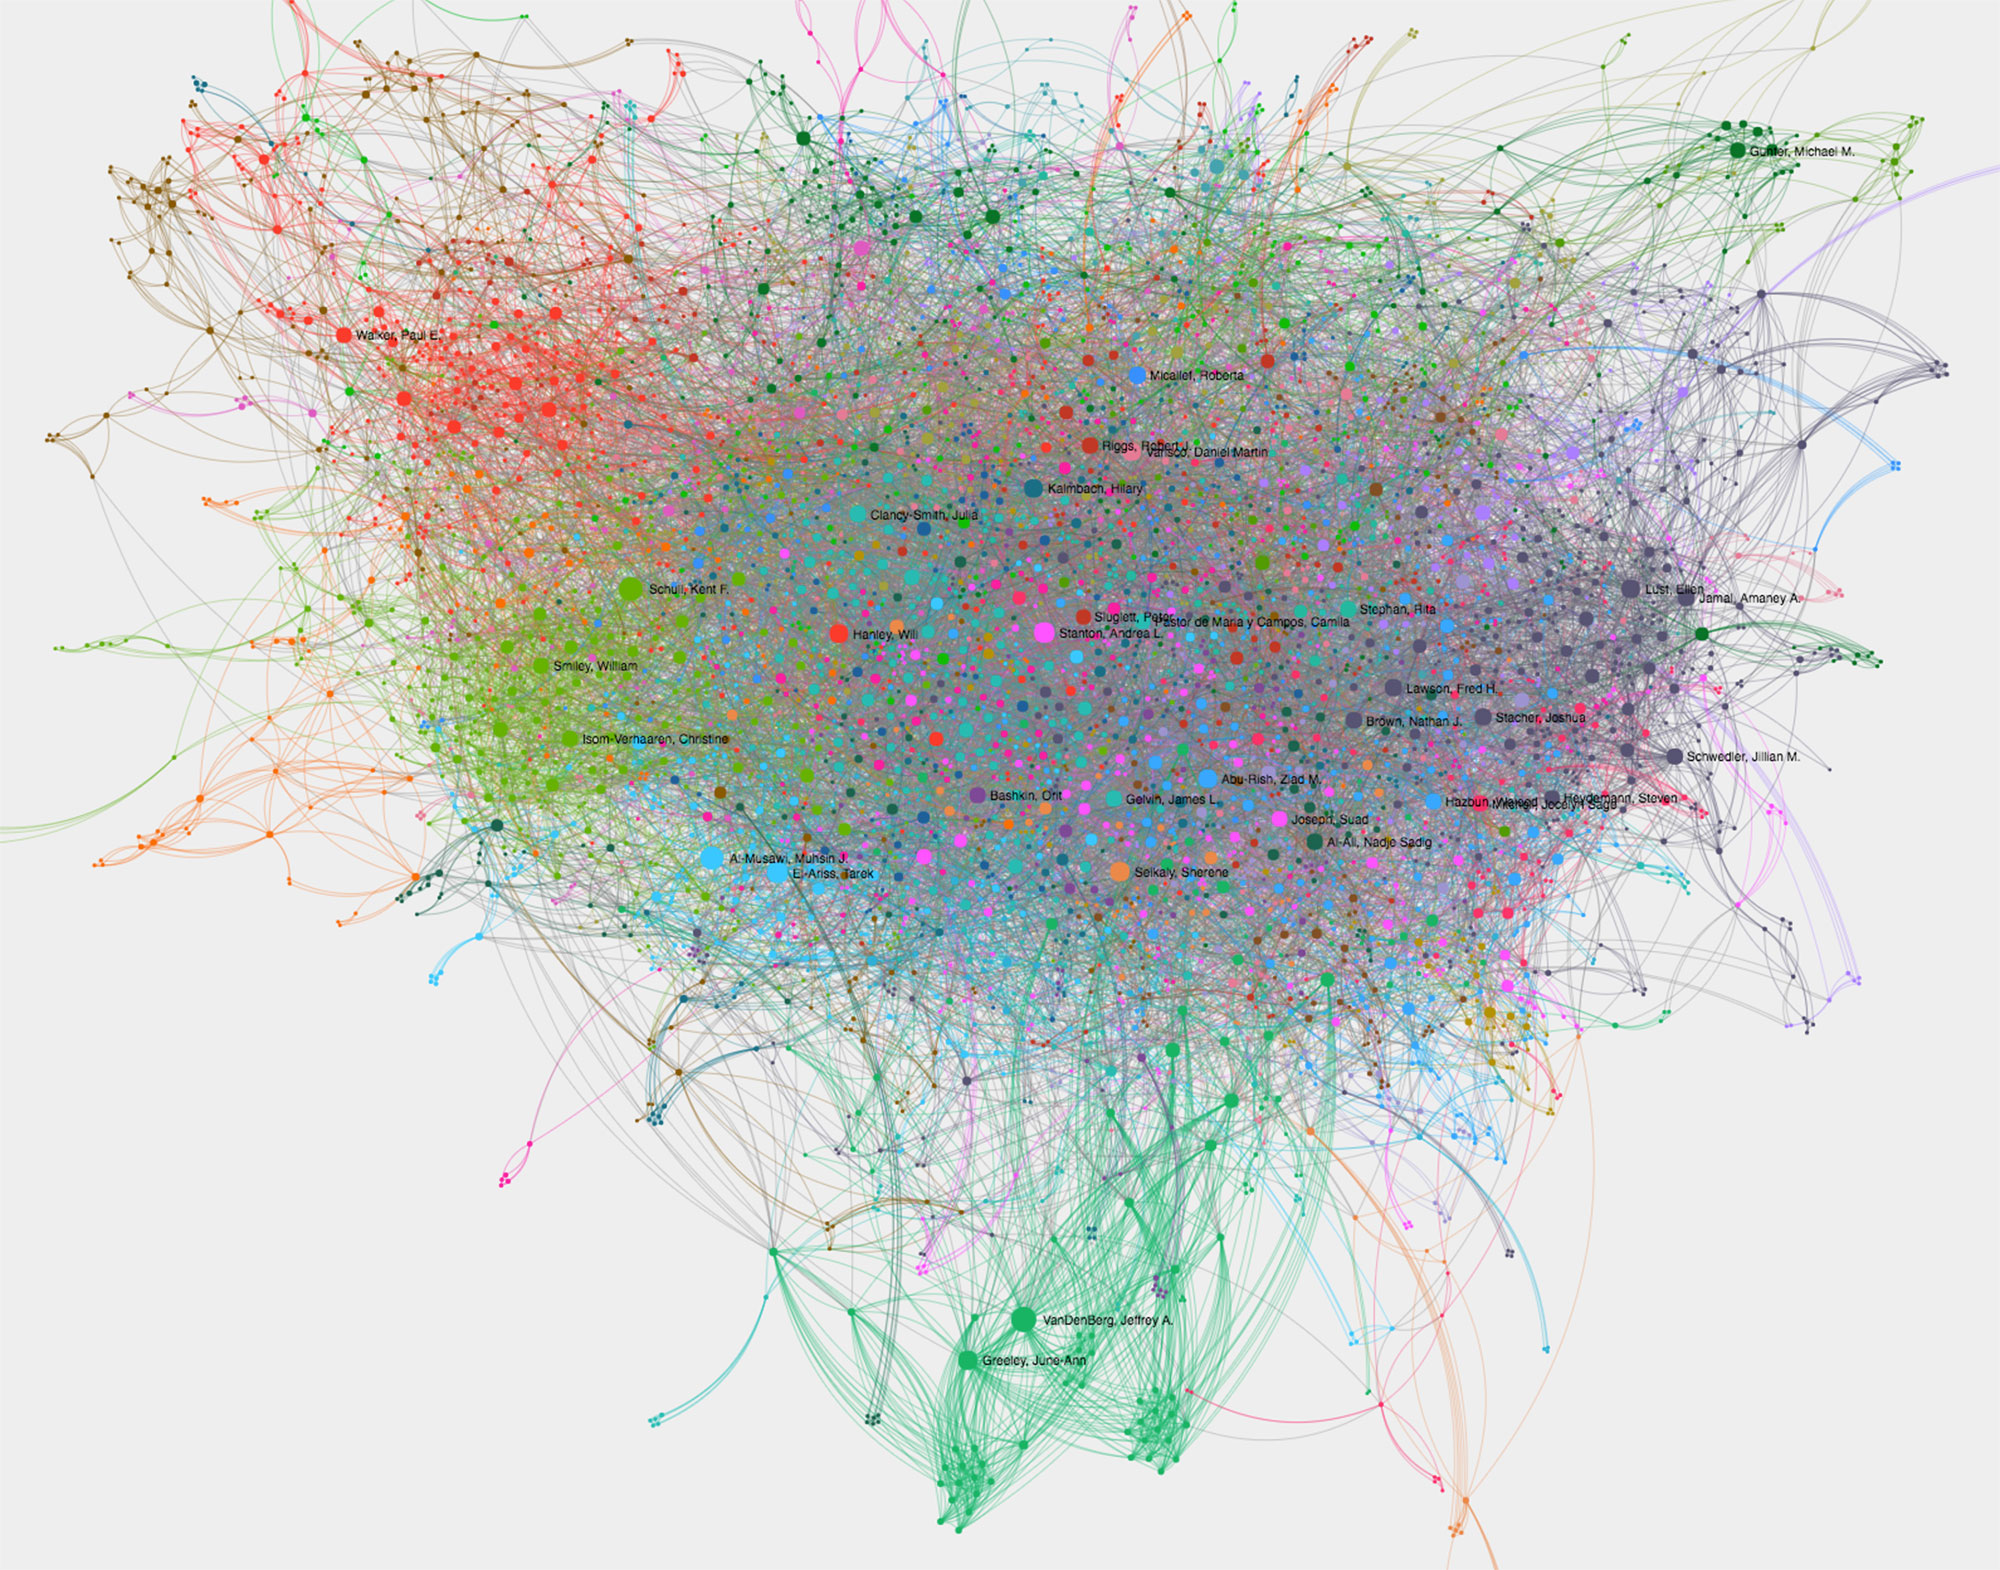
While the genealogy project is too far away from its maturity, we do have some other interesting data through which we can get a glimpse into the academic community that grew around MESA: we can use programs of annual meetings--in combination with academic profiles of MESA members (and, perhaps later, abstracts of their papers)--to gauge whether and how we are connected with each other across the field, how we form collegial communities and maintain them, and how these communities take new shapes in reaction to internal developments in the academy and to external political and social factors. The program data is limited in many ways, as it does not capture such connections as who attends panels, who engages into discussions with panelists, nor does it anywhere close to revealing who we hang out with between panels at the most attended areas of the conference. Additionally, only a limited number of programs is relatively accessible at the moment and our insight can go back in time only 8 years (2009--2017; all data used below is openly available at the official MESA Website).
Below you can find explanations of how the network was generated as well as summaries for each major intellectual community that can be identified in the data. You can also browse the network and find yourself there.
On data and method
The data has been collected from the official MESA website—only what is openly accessible has been included into the dataset (in other words, if you chose not to make your profile public, your data is not in the dataset). The data has been downloaded with wget and then reformatted with a series of scripts written in python. The data was then reformatted into a network model where scholars are connected through all the panels and sessions they participated in together. The weight is based on the number co-panelists. Scholars with multiple roles (such as an Organizer and a Presenter) were given more weight, to stress their active engagement. The network visualization has been built with Gephi, whose community detection algorithm was used to identify closely connected groups of scholars, orintellectual communities; the results were saved into an interactive network using Sigma.js plugin. Reports were then algorithmically generated for all major intellectual communities (with the size of at least 1%) using R, R Markdown, and the knitr package. Some data cleaning—mainly to unify different spellings—was done with OpenRefine.
What’s in community reports?
As stated above, communities were identified with the community detection algorithm in Gephi. Reports summarize formal descriptions that MESA members provide in their open academic profiles at the MESA website (disciplines, subfields, geographical areas of specialization, working languages, and degree granting institutions). Some members preferred not to share their profiles online, so their data was not included. In general, the most salient characteristics of communities offer a decent idea of what a given community is about. For example, Group 12 appears to be mostly about politics in modern Middle East; Group 15—mostly about premodern Islamic history and Islamic studies; Group 1—mostly about Ottoman studies, and so on.
Interestingly, there are multiple communities with the same—or, at least, comparable—thematic/subject foci, but they differ by alma maters, which shows that the formation of academic communities is tied to brick-and-mortar institutions (For example, Group 1 and Group 24 both appear to focus on Ottoman studies, but most of the scholars from the first group have degrees from American institutions, while the second one is dominated by scholars with degrees from Turkish institutions.
The networks of specific scholars often cross into multiple communities.
The most salient features of each community are statistical outliers on the high end of data distribution: i.e., items whose frequencies are higher than Q3 * 1.5 (items with frequency 1 were removed before determining quartiles).
Reports are organized by the size of communities (from largest to smallest).
Community reports
Group 12 (397 members)
The community has 397 members (7.73%). The most salient features of the community are as follows:
- Disciplines: Political Science (149), History (54), International Relations/Affairs (27);
- Subfields: Middle East/Near East Studies (113), Comparative (86), Democratization (74), Arab Studies (63), Political Economy (55), 19th-21st Centuries (52), Nationalism (44);
- Geographical focus: All Middle East (100), Egypt (79), Arab States (59), Iran (45), Syria (43), Turkey (41), Gulf (37);
- Languages of expertise: Arabic (214), French (155), English (122), Spanish (58), German (54), Turkish (48), Persian (48);
- Members have degrees from: Georgetown U (36), Harvard U (30), U Oxford (26), UC, Los Angeles (22), U Oslo (20), U Michigan (18), Princeton U (18), American U, Cairo (16), London School Economics (16), Oxford U (16), Brown U (16), U Chicago (16), U Virginia (14), New York U (14), SOAS (12), Yale U (10), Boğaziçi U (10), U Pennsylvania (10), Stanford U (8), U Massachusetts, Amherst (8), Johns Hopkins U (8), Cairo U (8), UC, Berkeley (8), Cornell U (8), U Washington (8), Tel-Aviv U (8), American U, Beirut (6), MIT (6), U Cambridge (6), U Florida (6), U Durham (6), LSE (6), Northwestern U (6), U Edinburgh (6), Institut d’Etudes Politiques de Paris (6), Columbia U (6), Ohio State U (6), U Tübingen (6), Western Michigan U (6), McGill U (6), Ankara U (6), IEP d’Aix-en-Provence (6);
- Most active members are: Lust, Ellen (103), Lawson, Fred H. (94), Jamal, Amaney A. (93), Stacher, Joshua (93), Brown, Nathan J. (89), Schwedler, Jillian M. (88), Heydemann, Steven (82), Albrecht, Holger (75), Anderson, Lisa (74), Patel, David Siddhartha (70), Lynch, Marc (69), Brownlee, Jason (63), Yadav, Stacey Philbrick (62), Beinin, Joel (60), Yom, Sean (59), Kamrava, Mehran (57), Pearlman, Wendy (54), Watenpaugh, Keith D. (54), Kurzman, Charles (54), Moghadam, Val (53), McDougall, James (53), Sallam, Hesham (52), Bellin, Eva (50), Bishara, Dina (50), Daoudy, Marwa (49), Utvik, Bjorn Olav (47), Altug, Seda (47), Tajali, Mona (44), Brooke, Steven T. (44), Herb, Michael (44), Vignal, Leila Marie Rebecca (42), Chalcraft, John T. (42), Schonmann, Noa (41), Nugent, Elizabeth R. (39), Hashemi, Nader (39), Benstead, Lindsay J. (39), Ciftci, Sabri (38), Haddad, Bassam (38), Fouladvand, Hengameh (38), Lucas, Russell (38), Valbjorn, Morten (37), Robson, Laura C. (37), White, Benjamin Thomas (36), Wuthrich, F. Michael (36), Ayoub, Samy (35), Gause III, F. Gregory (35), Karakoc, Ekrem (35), Bayat, Asef (34), Wedeen, Lisa (34), Blaydes, Lisa (34), Watenpaugh, Heghnar (32), Willis, Michael J. (32), Sowers, Jeannie (32), Semerdjian, Elyse (30), Volpi, Frederic (30), Moore, Pete W. (30), Gao, Eleanor (29), Goldberg, Ellis (28), Legrenzi, Matteo (28), Clarke, Killian (28), Rahal, Malika (27), Banko, Lauren (26), Vodopyanov, Anya (26), Reif, Megan E. (26).
Group 15 (342 members)
The community has 341 members (6.639%). The most salient features of the community are as follows:
- Disciplines: History (145), Religious Studies/Theology (41);
- Subfields: Islamic Studies (105), 7th-13th Centuries (102), Middle East/Near East Studies (81), Arabic (53), Medieval (48), Iranian Studies (44), Historiography (39), History of Religion (37), Gender/Women’s Studies (34), 19th-21st Centuries (33), Mediterranean Studies (32), 13th-18th Centuries (32), Comparative (26);
- Geographical focus: All Middle East (99), Islamic World (74), Iran (66), Egypt (62), Syria (34), Iraq (30), Mediterranean Countries (29);
- Languages of expertise: Arabic (209), French (165), German (109), Persian (104), English (74), Turkish (47), Spanish (47), Hebrew (43);
- Members have degrees from: Princeton U (56), U Chicago (56), Harvard U (44), Columbia U (36), UC, Los Angeles (28), U Michigan (24), U Toronto (24), New York U (20), U Pennsylvania (16), Oxford U (16), American U, Beirut (16), American U, Cairo (16), Yale U (14), UC, Santa Barbara (10), U Oxford (10), Duke U (10), U Virginia (10), UC, Berkeley (10);
- Most active members are: Hanley, Will (103), Walker, Paul E. (83), Romanov, Maxim (78), Borrut, Antoine (76), Ellis, Matthew Hal (73), Savant, Sarah Bowen (68), Donner, Fred M. (66), Khalek, Nancy (63), Humphreys, R. Stephen (53), Bulliet, Richard W. (52), Pinto, Karen C. (48), Shaindlinger, Noa (48), Nielson, Lisa (48), Pourshariati, Parvaneh (46), Hanssen, Jens-Peter (45), Judd, Steven C. (44), Hain, Kathryn (40), Hanaoka, Mimi (40), Jiwa, Shainool (38), Baker, Christine (38), Gordon, Matthew S. (38), Gaiser, Adam (38), Dabiri, Ghazzal (37), Keaney, Heather N. (36), Ghazal, Amal (34), Antrim, Zayde G. (34), Daftary, Farhad (33), Klasova, Pamela (31), Hoffman, Valerie J. (31), Weitz, Lev (31), Urban, Elizabeth (31), Vacca, Alison Marie (31), Hagler, Aaron (31), Reynolds, Dwight F. (30), Kholoussy, Hanan (30), Ulrich, Brian J. (30), Perry, Craig (29), Adem, Rodrigo (28), Ludvigsen, Barre (27), Bacharach, Jere L. (27), Bonner, Michael (27), Mourad, Suleiman A. (27), Haug, Robert (26), Noy, Avigail (26), La Porta, Sergio (26), Friedman, Rachel (25), Gomez-Rivas, Camilo (25), Catlos, Brian (24), Carlson, Thomas (24), Myrne, Pernilla (23), Monterescu, Daniel (23).
Group 1 (339 members)
The community has 338 members (6.581%). The most salient features of the community are as follows:
- Disciplines: History (199), Religious Studies/Theology (20);
- Subfields: Ottoman Studies (157), 13th-18th Centuries (93), Middle East/Near East Studies (80), Islamic Studies (61), 19th-21st Centuries (57), Turkish Studies (50), Islamic Law (40), Mediterranean Studies (34);
- Geographical focus: Ottoman Empire (127), Turkey (74), All Middle East (64), Islamic World (53), Anatolia (42), Balkans (42);
- Languages of expertise: Arabic (177), Turkish (163), French (156), German (105), Persian (98), English (91), Ottoman (75);
- Members have degrees from: Harvard U (64), Princeton U (58), U Chicago (58), Boğaziçi U (34), UC, Berkeley (28), Columbia U (28), Ohio State U (22), Georgetown U (22), U Michigan (20), UC, Los Angeles (20), Bilkent U (16), U Toronto (12), Middle East Technical U (12), McGill U (12), Yale U (12), New York U (12), U Oxford (10), Sabanci U (10), Tel-Aviv U (10), Rice U (8), Stanford U (8), Swarthmore College (6), Hebrew U (6), Istanbul U (6), U Pennsylvania (6), Emory U (6), Indiana U (6), Oxford U (6), U Cambridge (6), Hebrew U Jerusalem (6), Boston U (6);
- Most active members are: Schull, Kent F. (139), Smiley, William (88), Isom-Verhaaren, Christine (87), Curry, John (79), Mikhail, Alan (73), Gratien, Chris (71), Aksan, Virginia (68), Hathaway, Jane (66), Saracoglu, M. Safa (66), Singer, Amy (65), Low, Michael Christopher (65), Khoury, Dina Rizk (64), Darling, Linda T. (64), Genell, Aimee (54), Varlik, Nukhet (49), Barakat, Nora (45), Ayalon, Yaron (45), Cuno, Kenneth M. (44), Ginio, Eyal (44), Shefer-Mossensohn, Miri (43), Yildiz, Sara Nur (43), White, Joshua (42), Shafir, Nir (41), Karatas, Hasan (40), Philliou, Christine M. (40), Wilkins, Charles L. (39), Menguc, Murat (38), Pitts, Graham (38), Krstic, Tijana (38), Al-Tikriti, Nabil (38), Can, Lale (37), Melvin-Koushki, Matthew (37), Faroqhi, Suraiya (36), Weiss, Max (36), Griffith, Zoe (34), Pfeifer, Helen (34), Makdisi, Ussama (32), Baldwin, James E. (32), Ergene, Bogac (32), Emre, Side (31), Taylor, Malissa (31), Karakaya-Stump, Ayfer (31), Wittmann, Richard (31), Zarinebaf, Fariba (31), Babayan, Kathryn (31), Gardiner, Noah (30), Winter, Stefan (29), Artun, Tuna (29), Burak, Guy (29), Oztan, Ramazan Hakki (29), Stearns, Justin (29), Findley, Carter V. (29), Esmer, Tolga U. (29), Ashraf, Assef (29), Sen, Ahmet Tunc (28), Turkyilmaz, Zeynep (28), Ferguson, Heather (27).
Group 8 (330 members)
The community has 328 members (6.386%). The most salient features of the community are as follows:
- Disciplines: History (156), Anthropology (22);
- Subfields: Middle East/Near East Studies (99), 19th-21st Centuries (86), Colonialism (60), Nationalism (53), Ottoman Studies (45), Arab-Israeli Conflict (44), Arab Studies (44), Cultural Studies (36), Gender/Women’s Studies (36), Identity/Representation (35);
- Geographical focus: All Middle East (72), Palestine (64), Egypt (63), Ottoman Empire (56), Syria (40), Israel (39), Turkey (36), Lebanon (35), Arab States (27);
- Languages of expertise: Arabic (189), French (151), English (99), Turkish (67), Hebrew (59), German (56);
- Members have degrees from: UC, Los Angeles (36), Harvard U (30), U Chicago (28), Georgetown U (26), Columbia U (26), New York U (22), American U, Cairo (22), Tel-Aviv U (18), UC, Berkeley (14), Boğaziçi U (14), U Pennsylvania (14), Princeton U (14), U Michigan (14), Stanford U (12), Oxford U (12), U Oxford (12), Cairo U (10), American U, Beirut (10), U Toronto (10), McGill U (8), Bilkent U (8), MIT (8), Yale U (6), U Manchester (6), London School Economics (6), Indiana U (6), U London (6), FU, Berlin (6);
- Most active members are: Clancy-Smith, Julia (88), Gelvin, James L. (86), Pastor de Maria y Campos, Camila (81), Thompson, Elizabeth (78), Fahmy, Khaled (75), Halperin, Liora R. (71), Khater, Akram F. (69), Fleischmann, Ellen L. (65), Mazza, Roberto (61), Bailony, Reem (56), Falb Kalisman, Hilary (55), Barak, On (54), Aksakal, Mustafa (54), Tamari, Salim (53), Fahrenthold, Stacy (52), Mestyan, Adam (51), Wyrtzen, Jonathan (50), Robinson, Shira (49), Vitalis, Robert (49), Fortna, Benjamin Carr (48), Cohen, Julia (47), Sheehi, Stephen P. (46), Owen, Roger (46), Akin, Yigit (44), Alon, Yoav (43), Abou-Hodeib, Toufoul (42), Nassar, Issam (42), Tanielian, Melanie (42), Kozma, Liat (41), Eickelman, Dale F. (40), Robinson, Nova (39), Karamursel, Ceyda (39), Ryzova, Lucie (38), Moreau, Odile (38), Ismail, Shehab (38), Ayalon, Ami (38), Dallasheh, Leena (37), Gran, Peter (37), Hazkani, Shay (37), Campos, Michelle U. (36), Schwartz, Kathryn (36), Armanios, Febe (35), Provence, Michael (34), Lockman, Zachary (34), Minawi, Mostafa (34), Balsoy, Gulhan (33), Yanikdag, Yucel (33), Jacobson, Abigail (32), Greene, Annie (32), El-Husseiny, Momen (32), Degani, Arnon (31).
Group 10 (211 members)
The community has 210 members (4.089%). The most salient features of the community are as follows:
- Disciplines: Anthropology (50), History (32), Political Science (16);
- Subfields: Middle East/Near East Studies (52), Gender/Women’s Studies (46), Cultural Studies (30), 19th-21st Centuries (30), Identity/Representation (27), Nationalism (26), Urban Studies (23), Ethnography (23), Turkish Studies (21), Globalization (19), Arab Studies (18);
- Geographical focus: All Middle East (55), Egypt (38), Turkey (28), Iran (26), Lebanon (17);
- Languages of expertise: Arabic (99), French (78), English (60);
- Members have degrees from: Boğaziçi U (40), Columbia U (18), Princeton U (16), UT, Austin (16), U Arizona (16), Stanford U (16), New York U (14), U Chicago (14), Harvard U (14), UC, Los Angeles (14), Georgetown U (14), UC, Berkeley (10), Emory U (8), U Michigan (8), Oxford U (8), Yale U (8), U Oslo (6), Middle East Technical U (6), London School Economics (6), American U, Beirut (6);
- Most active members are: Stanton, Andrea L. (113), Joseph, Suad (82), Mills, Amy (78), Dougherty, Roberta L. (65), Mahdavi, Pardis (60), Hammad, Hanan H. (58), Katz, Kimberly B. (53), Foster, Angel M. (53), Gardner, Andrew (48), Motlagh, Amy (48), Chomiak, Laryssa (47), Inhorn, Marcia C. (45), Higgins, Annie C. (44), Shechter, Relli I. (44), Alemdaroglu, Ayca (44), Morrison, Heidi (44), Singerman, Diane (42), Salamandra, Christa (40), Wynn, Lisa L. (39), Ghannam, Farha (39), Boum, Aomar (38), Reynolds, Nancy Y. (37), Coslett, Daniel (36), Collins, Rodney WJ (34), Hashemi, Manata (34), Abul-Magd, Zeinab A. (34), Rahimieh, Nasrin (30), Sweis, Rania (30), Betteridge, Anne H. (30), Baron, Beth (27), Erami, Narges (26), Bozcali, Firat (26).
Group 9 (206 members)
The community has 206 members (4.011%). The most salient features of the community are as follows:
- Disciplines: History (35), Anthropology (34);
- Subfields: Middle East/Near East Studies (54), 19th-21st Centuries (34), Gender/Women’s Studies (32), Identity/Representation (32), Urban Studies (31), Colonialism (31), Maghreb Studies (28), Arab-Israeli Conflict (27), Development (25), Cultural Studies (25), Arab Studies (24), Nationalism (24), Diaspora/Refugee Studies (24), Comparative (22), Ethnography (22), Political Economy (21);
- Geographical focus: All Middle East (47), Palestine (38), Lebanon (29), Egypt (29);
- Languages of expertise: Arabic (115), French (89), English (69), Spanish (35), German (33);
- Members have degrees from: Columbia U (30), New York U (20), Harvard U (14), Oxford U (14), UC, Los Angeles (14), UC, Berkeley (12), Georgetown U (10), Bilkent U (10), Yale U (8), American U, Beirut (8), U Pennsylvania (8), York U (8), London School Economics (8), Ghent U (6), Princeton U (6), SOAS (6), U Wisconsin, Madison (6);
- Most active members are: Abu-Rish, Ziad M. (101), Hazbun, Waleed (83), Khalil, Osamah (70), Sbaiti, Nadya J. (67), Al-Hamarneh, Ala (63), Davis, Rochelle Anne (59), Kanna, Ahmed (58), Bsheer, Rosie (55), Atia, Mona (55), Bogaert, Koenraad (54), Parker, Christopher H. (52), Challand, Benoit (51), Rothenberg, Janell (50), Davis, Muriam Haleh (49), Zemni, Sami (48), Keshavarzian, Arang (47), Slyomovics, Susan (47), Yildiz, Murat C. (46), Sinno, Nadine (46), Cavatorta, Francesco (44), Volk, Lucia (44), Salime, Zakia (43), Bishara, Amahl (42), Hammond, Timur (41), Hermez, Sami (39), Adely, Fida (39), Meiton, Fredrik (39), Gunel, Gokce (39), Farah, May (38), Kraidy, Marwan M. (34), Khalili, Laleh (33), Farah, Randa R. (29), Altan-Olcay, Ozlem (29), Tawil Souri, Helga (29), Shirazi, Roozbeh (28), Bouziane, Malika (27), Gamblin, Sandrine (27).
Group 11 (201 members)
The community has 201 members (3.914%). The most salient features of the community are as follows:
- Disciplines: Language (55);
- Subfields: Arabic (76), Language Acquisition (45), Middle East/Near East Studies (41), Arab Studies (26), Education (25), Maghreb Studies (23), Sociolinguistics (23), Cultural Studies (22), Pedagogy (22), Identity/Representation (19);
- Geographical focus: Egypt (52), All Middle East (48), Arab States (28), Morocco (27), Maghreb (20);
- Languages of expertise: Arabic (127), French (81), English (71), Spanish (35);
- Members have degrees from: American U, Cairo (32), UT, Austin (24), U Arizona (18), Brigham Young U (12), New York U (12), U Michigan (12), Georgetown U (10), U Chicago (10), Princeton U (8), Ohio State U (8), Harvard U (8), U Wisconsin, Madison (8), Ain Shams U (6), Brown U (6), U Pennsylvania (6), U Texas (6), Florida State U (6);
- Most active members are: Idrissi Alami, Ahmed (60), Dana, Karam (40), Shiri, Sonia (39), Khannous, Touria (35), Aboel Seoud, Dalal (33), Amster, Ellen J. (33), Soliman, Iman Aziz (32), Al-Batal, Mahmoud (32), Al Khalil, Muhamed (30), Familiar, Laila (29), Brustad, Kristen (28), Marsans-Sakly, Silvia (28), Taha, Zeinab A. (27), Alhawary, Mohammad T. (27), Hirchi, Mohammed (26), Soulaimani, Dris (25), Esseesy, Mohssen (25), Essam, Rasha (24), Dardir, Ahmed (23), Basheer, Nesrine (23), Chakrani, Brahim (22), Eisele, John C. (22), El-Essawi, Raghda (22), Anishchenkova, Valerie (22), Terc, Mandy (22), Hassanein, Hanan (20), Toler, Michael A. (19), Angrist, Michele Penner (19), Yacout, Shahira (19), Smith, Sharon C (19), Stokes, Corinne (18), Chekayri, Abdellah (18), Glanville, Peter (18), Loomis, Summer (18).
Group 24 (197 members)
The community has 196 members (3.816%). The most salient features of the community are as follows:
- Disciplines: History (59), Political Science (25);
- Subfields: Ottoman Studies (49), Turkish Studies (47), Middle East/Near East Studies (46), Nationalism (40), Armenian Studies (39), 19th-21st Centuries (39), Kurdish Studies (38), Identity/Representation (34), Minorities (26), Gender/Women’s Studies (26), Diaspora/Refugee Studies (22), Cultural Studies (20);
- Geographical focus: Turkey (79), Ottoman Empire (48), All Middle East (35);
- Languages of expertise: Turkish (94), French (74), English (71), Arabic (64);
- Members have degrees from: Boğaziçi U (30), UC, Los Angeles (20), Bilkent U (14), U Michigan (12), Columbia U (12), U Chicago (12), Middle East Technical U (12), Ankara U (12), Yale U (10), Princeton U (10), Harvard U (10), New York U (8), Sabanci U (8), Carleton U (8), Istanbul U (8), U Virginia (6), U Arizona (6), UC, Berkeley (6), U Toronto (6);
- Most active members are: Gunter, Michael M. (82), Gocek, Fatma Muge (74), Der Mugrdechian, Barlow (72), Sinclair, Christian (67), Igsiz, Asli Z. (62), Cora, Yasar Tolga (56), Eccarius-Kelly, Vera (56), Klein, Janet (48), Derderian, Dzovinar (46), Ahmed, Mohammed M.A. (44), Olson, Robert W. (43), Der Matossian, Bedross (42), Ekmekcioglu, Lerna (42), Bertram, Carel (38), Hepkaner, Ilker (37), Koker, Ayse Neveser (36), Kurt, Umit (32), Entessar, Nader (31), Melkonian, Doris (28), Meyer, James Howard (27), Ulker, Erol (26).
Group 31 (181 members)
The community has 180 members (3.505%). The most salient features of the community are as follows:
- Disciplines: History (78);
- Subfields: Middle East/Near East Studies (42), 19th-21st Centuries (42), Gender/Women’s Studies (32), Colonialism (30), Ottoman Studies (27), Cultural Studies (23), World History (19), Nationalism (18), Identity/Representation (17), Comparative (17);
- Geographical focus: All Middle East (47), Egypt (30), Turkey (22), Ottoman Empire (21), Palestine (16), Iran (15);
- Languages of expertise: Arabic (85), French (57), English (53);
- Members have degrees from: Georgetown U (22), New York U (18), U Arizona (12), UC, Los Angeles (12), Yale U (10), U Chicago (10), Harvard U (10), Boğaziçi U (10), Tel-Aviv U (10), Middle East Technical U (8), U Denver (8), McGill U (6), Bilkent U (6), Columbia U (6), Rutgers U (6), Ohio State U (6), UT, Austin (6), Princeton U (6);
- Most active members are: Gordon, Joel (59), Akturk, Ahmet Serdar (57), Minkin, Shana E. (47), Khazeni, Arash (47), Haiduc-Dale, Noah (43), Dolbee, Samuel (43), Parnell, Matthew (42), Kazemi, Ranin (40), Sharkey, Heather J. (39), Ates, Sabri (36), Goffman, Laura (35), Scalenghe, Sara (33), Yousef, Hoda (32), Lattouf, Mirna (32), Hallward, Maia Carter (31), Kaler, Helena (29), Bawalsa, Nadim (29), Arabaci, Elcin (27), Pehlivan, Zozan (26), Kuehn, Thomas (26), Pollard, Lisa (26), Deguilhem, Randi C. (25), Fares, Nicole (24), Whidden, James (24), Orkaby, Asher (24).
Group 4 (177 members)
The community has 177 members (3.446%). The most salient features of the community are as follows:
- Disciplines: History (44);
- Subfields: 19th-21st Centuries (48), Middle East/Near East Studies (44), Gender/Women’s Studies (40), Colonialism (36), Islamic Studies (33), Arab Studies (24), Identity/Representation (24), Maghreb Studies (22), Cultural Studies (22), Nationalism (20), Transnationalism (20);
- Geographical focus: All Middle East (27), Egypt (25), Palestine (24), Islamic World (23), Maghreb (22), Europe (18);
- Languages of expertise: Arabic (114), French (88), English (44), Spanish (33);
- Members have degrees from: Columbia U (32), Harvard U (30), Yale U (18), U Cambridge (14), Georgetown U (14), U Chicago (14), New York U (14), Oxford U (12), U Oxford (10), U Michigan (10), McGill U (8), Princeton U (8), UC, Berkeley (8), George Washington U (6), American U, Beirut (6), U Toronto (6), Ohio State U (6);
- Most active members are: Kalmbach, Hilary (100), Esmeir, Samera (57), Starrett, Gregory (52), Jacob, Wilson Chacko (51), Farquhar, Michael (44), Dalsheim, Joyce (40), Arsan, Andrew K. (37), Hammer, Juliane (35), Hartman, Michelle (34), Tucker, Judith E. (33), Hassan, Mona F (33), Ben-Yehoyada, Naor (32), Rock-Singer, Aaron (32), Gaul, Anny (31), Shryock, Andrew J. (31), Schneider, Suzanne (30), Ernst, Carl W. (28), Bamyeh, Mohammed A. (27), Green, Nile (26), Abi-Mershed, Osama (26), Armijo, Jacqueline (25), Skalli, Loubna Hanna (25), Ferguson, Susanna (25), Scott Deuchar, Hannah (23), Lybarger, Loren (23), Driessen, Michael (21), Cornwell, Graham (21).
Group 2 (173 members)
The community has 173 members (3.368%). The most salient features of the community are as follows:
- Disciplines: Literature (84), History (24);
- Subfields: Arabic (65), Comparative (46), Arab Studies (40), Middle East/Near East Studies (39), 19th-21st Centuries (35), Gender/Women’s Studies (29), Cultural Studies (28), Colonialism (21), Identity/Representation (19), Islamic Studies (19), Translation (18), Maghreb Studies (18);
- Geographical focus: All Middle East (45), Egypt (39);
- Languages of expertise: Arabic (115), French (90), English (51);
- Members have degrees from: Columbia U (32), American U, Beirut (22), Indiana U (22), UT, Austin (20), New York U (20), U Pennsylvania (18), U Chicago (14), American U, Cairo (14), Harvard U (14), Yale U (12), Princeton U (12), UC, Berkeley (10);
- Most active members are: Al-Musawi, Muhsin J. (131), El-Ariss, Tarek (115), Stetkevych, Suzanne P. (69), Al-Samman, Hanadi (67), Salama, Mohammad (61), Nalbantian, Tsolin (58), Al-Ghadeer, Moneera (57), Halabi, Zeina G. (48), Head, Gretchen A. (45), Giordani, Angela (41), Taleghani, R. Shareah (39), Cooke, Miriam (39), El Guabli, Brahim (37), Al-Saleh, Asaad (32), Golley, Nawar Al-Hassan (32), Holt, Elizabeth (32), Hermes, Nizar F. (31), Ramadan, Yasmine (31), Saba, Elias (30), Paul, Drew (30), Sellman, Johanna (30), Powers, David S. (29).
Group 6 (167 members)
The community has 167 members (3.252%). The most salient features of the community are as follows:
- Disciplines: History (28), Political Science (23);
- Subfields: Middle East/Near East Studies (51), Islamic Studies (29), Arab Studies (24), Arabic (19), Islamic Law (18);
- Geographical focus: All Middle East (46), Yemen (30), Egypt (25), Islamic World (25), Arab States (18), Syria (18);
- Languages of expertise: Arabic (110), French (73), English (64), German (42);
- Members have degrees from: U Pennsylvania (16), U Chicago (14), American U, Cairo (10), UC, Berkeley (10), New York U (10), U Notre Dame (8), U Vienna (8), Harvard U (8), Charles U in Prague (6), Yale U (6), Cairo U (6), Sapienza - U Rome (6), U Bonn (6), Stanford U (6);
- Most active members are: Varisco, Daniel Martin (97), Carapico, Sheila (61), Schmitz, Charles P. (57), Hollenberg, David B. (49), Correa, Dale J. (45), Kaufman, Asher (42), Mahdi, Waleed (34), Hudson, Michael C. (33), Dahlgren, Susanne (30), Mahoney, Daniel (30), Steinbeiser, Stephen (29), Casey, James (28), Sika, Nadine (28), Regourd, Anne (27), Mohamed, Eid (27), Sisler, Vit (27), Adra, Najwa (26), Walbridge, John (25), Um, Nancy Ajung (25), Guenther, Sebastian (25), Atassi, Ahmad Nazir (25), Alsultany, Evelyn (24), Michalak, Laurence O. (24), Jarmakani, Amira (23), Schultz, Warren C. (23), Hennessey, Katherine (22), Cimino, Matthieu (22), Zerhouni, Saloua (22), Meier, Daniel (21), Silzell, Sharon (21), Baumann, Hannes (21).
Group 5 (154 members)
The community has 154 members (2.998%). The most salient features of the community are as follows:
- Disciplines: Literature (31), Political Science (21);
- Subfields: Middle East/Near East Studies (43), Arabic (39), Turkish Studies (35), Gender/Women’s Studies (28), Cultural Studies (27), Nationalism (24), Comparative (20), Identity/Representation (19), 19th-21st Centuries (16), Arab Studies (16), Islamic Studies (15);
- Geographical focus: All Middle East (50), Turkey (36), Egypt (27), Iran (25), Europe (18);
- Languages of expertise: Arabic (82), French (60);
- Members have degrees from: Georgetown U (18), Harvard U (16), Boğaziçi U (12), Bilkent U (12), U Arizona (12), Indiana U (12), UC, Berkeley (10), American U, Cairo (10), U Pennsylvania (10), U Chicago (10), Columbia U (10), New York U (10), UC, Los Angeles (10), Emory U (8), Katholieke Universiteit Leuven (6), UT, Austin (6), Yale U (6), U Michigan (6), U Utah (6);
- Most active members are: Colla, Elliott (59), Ramadan, Dina A. (58), Zencirci, Gizem (50), Isik, Damla (45), Kocamaner, Hikmet (43), Jorgensen, Cory (36), White, Jenny B. (35), Ali, Samer M. (34), Thompson, Thomas (34), Atanassova, Gergana (30), Shively, Kim (28), Smith, Sarah-Neel (28), Carney, Josh (26), Drumsta, Emily (25), Trentman, Emma (25), Cinar, Alev (24), Harb, Lara (23), Tanyeri-Erdemir, Tugba (23).
Group 20 (151 members)
The community has 151 members (2.94%). The most salient features of the community are as follows:
- Disciplines: History (39), Political Science (22);
- Subfields: Middle East/Near East Studies (50), Islamic Studies (41), Iranian Studies (33), 19th-21st Centuries (24), Comparative (21), Arab Studies (18);
- Geographical focus: All Middle East (49), Iran (45), Lebanon (25), Islamic World (23), Iraq (20), Arab States (19);
- Languages of expertise: Arabic (95), French (64), Persian (57), English (43), German (34);
- Members have degrees from: U Chicago (16), Harvard U (16), American U, Beirut (16), McGill U (12), Yale U (12), Princeton U (10), Columbia U (10), U Michigan (8), U Oxford (8), UT, Austin (8), U Utah (6), American U, Cairo (6), Tehran U (6), Oxford U (6), Tel-Aviv U (6), UC, Los Angeles (6), U Wisconsin, Madison (6), Brown U (6), UC, Berkeley (6);
- Most active members are: Riggs, Robert J. (87), Sluglett, Peter (80), Kuenkler, Mirjam (71), Heern, Zackery (70), El-Husseini, Rola (66), Cole, Juan (54), Leichtman, Mara (53), Browers, Michaelle L. (47), Baroudi, Sami Emile (43), Hayek, Ghenwa (43), Yazdani, Mina (41), Asatryan, Mushegh (40), Mottahedeh, Roy (38), Abidor, Pascal (38), Haider, Najam (38), Sayed, Linda (34), Barnwell, Kristi N. (32), Anthony, Sean (31), Rahimi, Babak (29), Shehadi, Nadim (29), Lob, Eric (26), El-Karanshawy, Samer (26), Arslan, Ceylan Ceyhun (26).
Group 27 (149 members)
The community has 149 members (2.901%). The most salient features of the community are as follows:
- Disciplines: History (39), Literature (38);
- Subfields: Persian (38), Iranian Studies (35), 13th-18th Centuries (29), 19th-21st Centuries (20), Gender/Women’s Studies (20), Middle East/Near East Studies (20), Arabic (17), Cultural Studies (17), Ottoman Studies (16), Islamic Studies (15), Comparative (15);
- Geographical focus: Iran (59), All Middle East (29), Central Asia (24);
- Languages of expertise: Arabic (72), Persian (63), French (53);
- Members have degrees from: U Chicago (28), UT, Austin (20), Harvard U (14), New York U (12), The U Chicago (10), Oxford U (10), Yale U (10), UC, Los Angeles (10), U Michigan (8), Columbia U (8), Princeton U (8), U Oxford (6), U Arizona (6), Eotvos Lorand U (6), UC, Irvine (6), UC, Berkeley (6), Brown U (6);
- Most active members are: Lewis, Franklin D. (47), Losensky, Paul E. (46), Atwood, Blake (44), Jabbari, Alexander (39), Kuru, Selim (35), Cross, Cameron (35), Miller, Matthew Thomas (35), Litvin, Margaret (34), Moosavi, Amir (32), Khorrami, Mohammad Mehdi (32), Hershenzon, Daniel (31), Galarreta-Aima, Diana (30), Ghanoonparvar, Mohammad R. (29), Khakpour, Arta (28), Kia, Mana (27), Green Mercado, Marya Teresa (27), Scoville, Spencer (26), Alavi, Samad J. (26), Karamustafa, Ahmet T. (26), Brookshaw, Dominic (26).
Group 22 (142 members)
The community has 141 members (2.745%). The most salient features of the community are as follows:
- Disciplines: Political Science (45);
- Subfields: Middle East/Near East Studies (37), Maghreb Studies (31), Comparative (26), Gender/Women’s Studies (24), Cultural Studies (22), Democratization (19), Islamic Studies (16), Political Economy (16);
- Geographical focus: Maghreb (35), All Middle East (32), Turkey (19), Egypt (17), Algeria (16);
- Languages of expertise: Arabic (75), French (64), English (41);
- Members have degrees from: Georgetown U (12), New York U (12), Harvard U (8), Yale U (8), Oxford U (8), UT, Austin (8), Florida State U (6), Stanford U (6), McGill U (6), U Chicago (6), U Oxford (6), Bilkent U (6), SOAS (6), Syracuse U (6);
- Most active members are: Mundy, Jacob A. (79), Lawrence, William A. (66), Parks, Robert P. (56), Zoubir, Yahia (55), Entelis, John P. (53), Turam, Berna (50), Layachi, Azzedine (50), Roberts, Hugh (40), Cutler, Brock (38), Gray, Doris H. (36), Youssef, Maro (35), Heper, Metin (32), Marks, Monica L. (29), Seferdjeli, Ryme (27), Segalla, Spencer (25), Romanet Perroux, Jean-Louis (25), Engelcke, Dörthe (25), Buehler, Matt (25), Maddy-Weitzman, Bruce (25), Gorman, Brandon (24), Naylor, Phillip (24), Sezgin, Yüksel (22), Joubin, Rebecca (21), Deubel, Tara (21), Gershovich, Moshe (19), Zvan Elliott, Katja (18), Guran, Gozde (18).
Group 3 (140 members)
The community has 140 members (2.726%). The most salient features of the community are as follows:
- Disciplines: History (36), Political Science (27);
- Subfields: Turkish Studies (59), Middle East/Near East Studies (36), Ottoman Studies (32), 19th-21st Centuries (25), Comparative (22), Gender/Women’s Studies (21), Nationalism (18), Democratization (16), Modernization (15), State Formation (15);
- Geographical focus: Turkey (69), Ottoman Empire (31), All Middle East (28), Europe (18);
- Languages of expertise: Turkish (71), Arabic (51), French (50), English (44);
- Members have degrees from: Boğaziçi U (42), U Washington (18), U Chicago (16), U Michigan (8), Uludag U (8), Columbia U (8), UC, Los Angeles (8), Georgetown U (6), U Virginia (6), U Pennsylvania (6), Duke U (6), Princeton U (6), ME Tech U (6), Istanbul Technical U (6), Istanbul U (6), U Tokyo (6), New York U (6), U Utah (6);
- Most active members are: Aslan, Senem (60), Kasaba, Resat (58), Jackson, Maureen (50), Tezcur, Gunes Murat (49), Shissler, A. Holly (46), Mecham, Quinn (42), Libal, Kathryn (42), Parslow, Joakim (40), Woodall, G. Carole (39), Gokariksel, Banu (39), Ryan, James (34), Hart, Kimberly (32), Belge, Ceren (32), Kirecci, M. Akif (31), Kezer, Zeynep (26), Secor, Anna (26), Watts, Nicole (25), Sarfati, Yusuf (25), Bakkalbasioglu, Esra (22), Karaman, Emine Rezzan (21), Ringer, Monica (21), Kirdis, Esen (21), Snyder, Alison B. (21).
Group 16 (133 members)
The community has 133 members (2.59%). The most salient features of the community are as follows:
- Disciplines: Literature (23), History (20);
- Subfields: Gender/Women’s Studies (57), Middle East/Near East Studies (33), Cultural Studies (23), Colonialism (20), 19th-21st Centuries (19), Nationalism (17), Comparative (17), Arab Studies (17), Identity/Representation (15), Maghreb Studies (14);
- Geographical focus: All Middle East (34), Egypt (24);
- Languages of expertise: Arabic (73), French (62), English (34);
- Members have degrees from: Cairo U (16), Georgetown U (10), Boğaziçi U (10), Indiana U (10), UC, Los Angeles (10), U Toronto (6), Harvard U (6), American U, Cairo (6), U Amsterdam (6), Columbia U (6), Arizona State U (6), U Exeter (6), Aristotle U Thessaloniki (6);
- Most active members are: Al-Ali, Nadje Sadig (87), Nassif, Maggie (59), Kallander, Amy (57), Fay, Mary Ann (55), Abdelmonem, Angie (54), Rizzo, Helen M. (53), Elsadda, Hoda (51), Langohr, Vickie (51), Hasso, Frances S. (46), Pratt, Nicola (45), Tadros, Mariz (42), Gana, Nouri (39), Richter-Devroe, Sophie (39), Yilmaz, Secil (37), Khoury, Nicole (36), Hale, Sondra (35), Mamelouk, Douja (33), Belnap, R. Kirk (33), Beard, Michael (32), Benson-Sokmen, Susan (31), Galan, Susana (30), Jamal, Manal A. (30).
Group 13 (127 members)
The community has 127 members (2.473%). The most salient features of the community are as follows:
- Disciplines: History (35), Anthropology (14);
- Subfields: Middle East/Near East Studies (26), 19th-21st Centuries (20), Gulf Studies (18), Islamic Studies (14), Colonialism (14);
- Geographical focus: All Middle East (21), Gulf (18), Egypt (16), Palestine (13), Turkey (12), Islamic World (11);
- Languages of expertise: Arabic (64), French (46), English (30);
- Members have degrees from: Columbia U (16), Harvard U (14), UC, Los Angeles (14), Georgetown U (10), Yale U (8), Princeton U (8), UT, Austin (6), U Michigan (6);
- Most active members are: VanDenBerg, Jeffrey A. (145), Greeley, June-Ann (105), Jones, Toby C. (75), Hafez, Sherine M. (74), Mako, Shamiran (71), Fuccaro, Nelida (62), Bishara, Fahad A. (59), Al-Nakib, Farah (58), Nakissa, Aria (57), Kim, Somy (56), Stamatopoulou-Robbins, Sophia (54), El-Kazaz, Sarah (48), Hightower, Victoria (48), Shereen Sakr, Laila (44), Cavdar, Gamze (43), Limbert, Mandana E. (43), El Hayek, Chantal (42), Barnes, Jessica E. (41), Elhaies, Karim (39), Farmer, Tessa (38), Anderson, Jedidiah (38), Dailami, Ahmed (37).
Group 17 (124 members)
The community has 124 members (2.414%). The most salient features of the community are as follows:
- Disciplines: History (41);
- Subfields: Middle East/Near East Studies (34), Turkish Studies (31), Ottoman Studies (30), 19th-21st Centuries (23), Islamic Studies (23), Nationalism (17), Iranian Studies (16), Central Asian Studies (14);
- Geographical focus: Turkey (38), Ottoman Empire (29), All Middle East (27), Iran (20), Central Asia (15);
- Languages of expertise: Arabic (49), Turkish (45), French (43), English (36);
- Members have degrees from: U Chicago (18), Harvard U (18), Columbia U (12), Marmara U (12), Boğaziçi U (10), Middle East Technical U (10), U Utah (10), Bilkent U (8), Indiana U (8), Sabanci U (6), Georgetown U (6), American U, Beirut (6), New York U (6), U Arizona (6);
- Most active members are: Yilmaz, Hale (77), Deal, Roger A. (54), Evered, Emine Ö. (53), Atamaz, Serpil (38), Beben, Daniel (33), Gross, Jo-Ann (33), Riaz, Sanaa (32), Childress, Faith J. (31), DeWeese, Devin A. (27), Kudsieh, Suha (23), Goffman, Carolyn (23), Andani, Khalil (23), Tasdelen, Esra (23), Ziad, Waleed (22), Mitchell, Jeanene (22), Adak, Sevgi (20), Metinsoy, Murat (20), Matin-Asgari, Afshin (19), Asmi, Rehenuma (18), Cook Jr., Weston F. (18), Tsacoyianis, Beverly (18), Turan, Omer (18), Hajiani, Shiraz (18).
Group 7 (123 members)
The community has 123 members (2.395%). The most salient features of the community are as follows:
- Disciplines: Political Science (23);
- Subfields: Middle East/Near East Studies (41), Gulf Studies (31), Gender/Women’s Studies (25), Development (20), Political Economy (17);
- Geographical focus: All Middle East (33), Gulf (27), Arabian Peninsula (20), Egypt (17), Arab States (14), UAE (13);
- Languages of expertise: Arabic (66), English (47), French (46);
- Members have degrees from: U Chicago (22), Georgetown U (10), Princeton U (10), U Michigan (8), Oxford U (8), U Cambridge (8), Bilkent U (6), Yale U (6), Boğaziçi U (6), UC, Berkeley (6), Johns Hopkins U (6), New York U (6), Columbia U (6);
- Most active members are: Mitchell, Jocelyn Sage (86), Pursley, Sara (66), Foley, Sean (58), Vora, Neha (54), Okruhlik, Gwenn (51), Lori, Noora (44), MacLean, Matthew (36), Derderian, Elizabeth (34), Lowi, Miriam R. (34), Brouwer, Imco (32), Koch, Natalie (32), Coates Ulrichsen, Kristian (31), Tetreault, Mary Ann Reed (31), Aghdasifar, Tahereh (31), Cahill, Richard (30), Jones, Calvert (30), Willis, John M. (29), Babar, Zahra (29), Diwan, Kristin Smith (27).
Group 23 (113 members)
The community has 113 members (2.2%). The most salient features of the community are as follows:
- Disciplines: Literature (20), History (18), Political Science (15);
- Subfields: Turkish Studies (41), Ottoman Studies (25), Middle East/Near East Studies (24), Turkish (21), Gender/Women’s Studies (21), Cultural Studies (16), 19th-21st Centuries (15), Comparative (14), Nationalism (13), Language Acquisition (12), Islamic Studies (12);
- Geographical focus: Turkey (50), All Middle East (30), Ottoman Empire (25), Europe (15);
- Languages of expertise: Turkish (57), Arabic (41);
- Members have degrees from: Boğaziçi U (34), Indiana U (14), U Washington (12), U Michigan (10), UT, Austin (10), UC, Los Angeles (8), U Texas (8), Ohio State U (8), U Pennsylvania (6), Harvard U (6), Texas Tech U (6);
- Most active members are: Micallef, Roberta (91), Gilson, Erika H. (48), Andrews, Walter G. (47), Karahan, Burcu (44), Seviner, Zeynep (41), Havlioglu, Didem (40), Okur, Jeannette E. (34), Wishnitzer, Avner (34), Hafez, Melis (34), Onder, Sylvia W. (32), VanderLippe, John M. (32), Batur, Pinar (31), Kafadar, Cemal (30), Aguirre Mandujano, Oscar (28), Carter, Sandra G. (28), Balci, Ercan (25), Toensing, Chris (24), Eissenstat, Howard (23).
Group 14 (109 members)
The community has 109 members (2.122%). The most salient features of the community are as follows:
- Disciplines: Anthropology (20);
- Subfields: Middle East/Near East Studies (24), Gender/Women’s Studies (21), Colonialism (17), Maghreb Studies (15), Political Economy (13), 19th-21st Centuries (13), Cinema/Film (13), Cultural Studies (13), Arab-Israeli Conflict (12);
- Geographical focus: All Middle East (28), Palestine (17), Maghreb (14), Lebanon (12), Arab States (11);
- Languages of expertise: Arabic (54), French (44), English (20), Spanish (14);
- Members have degrees from: U Arizona (12), New York U (10), Yale U (10), U Michigan (8), UC, Los Angeles (8), U Toronto (8), Georgetown U (8), U Chicago (6), UC, Berkeley (6), U Washington (6), Boston U (6);
- Most active members are: Yaqub, Nadia G. (79), Cammett, Melani C. (74), Clark, Janine A. (72), Amar, Paul (55), Bishop, Elizabeth (48), Amireh, Amal (39), Gasper, Michael (32), Baun, Dylan (32), Quawas, Rula (31), Schulhofer-Wohl, Jonah (28), Hoffman, Katherine E. (24), Sayej, Caroleen (23), Goodman, Jane E. (22), Rahman, Najat (21).
Group 30 (109 members)
The community has 109 members (2.122%). The most salient features of the community are as follows:
- Disciplines: Anthropology (28);
- Subfields: Middle East/Near East Studies (34), Islamic Studies (33), 19th-21st Centuries (16), Cultural Studies (16), Diaspora/Refugee Studies (14), Transnationalism (13), Ethnography (12), Islamic Thought (11);
- Geographical focus: Egypt (23), All Middle East (20), Islamic World (14), Europe (13);
- Languages of expertise: Arabic (60), French (46), English (35);
- Members have degrees from: U Michigan (8), Columbia U (8), American U, Beirut (8), New York U (6), U London (6), Georgetown U (6), London School Economics (6), Sciences Po Paris (6), U Toronto (6), U Oxford (6), Harvard U (6);
- Most active members are: Voll, John O. (67), Cesari, Jocelyne (48), Chatty, Dawn (46), Moll, Yasmin (44), Winegar, Jessica (41), Armbrust, Walter (36), Totah, Faedah (35), Naguib, Nefissa (35), Abenante, Paola (35), Vicini, Fabio (34), Schielke, Joska Samuli (30), Gabiam, Nell (29), Bergh, Sylvia (27), McLarney, Ellen (25), Ahmad, Attiya (24), Miller, W. Flagg (23), Herrera, Linda (23).
Group 19 (105 members)
The community has 105 members (2.044%). The most salient features of the community are as follows:
- Disciplines: History (37);
- Subfields: Iranian Studies (27), Middle East/Near East Studies (25), Cultural Studies (24), 19th-21st Centuries (22), Gender/Women’s Studies (20), Maghreb Studies (19), Colonialism (16), Nationalism (14), Islamic Studies (12), Cinema/Film (12);
- Geographical focus: Iran (31), All Middle East (30), Morocco (18), Maghreb (16);
- Languages of expertise: Arabic (61), French (52);
- Members have degrees from: U Toronto (12), UC, Los Angeles (12), Tel-Aviv U (10), Ben Gurion U the Negev (10), U Texas (8), U Chicago (8), Boğaziçi U (8), Harvard U (8), Cornell U (6);
- Most active members are: Sternfeld, Lior (70), Miller, Susan Gilson (60), Heckman, Alma (53), Swedenburg, Ted (47), Terem, Etty (44), Mottahedeh, Negar (39), Stenner, David (38), Calderwood, Eric (38), Marglin, Jessica M. (36), Lawrence, Adria (36), Gottreich, Emily R. (35), Tavakoli-Targhi, Mohamad (33), Schreier, Joshua (33), Amini, Soheyl (31), Ariel, Ari (30), Schroeter, Daniel J. (29), Kapchan, Deborah A. (29), Shemer, Yaron (29), Meftahi, Ida (27).
Group 28 (100 members)
The community has 100 members (1.947%). The most salient features of the community are as follows:
- Disciplines: History (18);
- Subfields: Middle East/Near East Studies (22), 19th-21st Centuries (21), Cultural Studies (19), Gender/Women’s Studies (18), Political Economy (17);
- Geographical focus: All Middle East (24), Turkey (15), Europe (14);
- Languages of expertise: Arabic (53), French (43), English (38);
- Members have degrees from: McGill U (8), Lund U (8), UT, Austin (6), U Michigan (6), U Exeter (6);
- Most active members are: Olmsted, Jennifer (54), Ruiz, Mario M. (49), Kechriotis, Vangelis (47), Stockdale, Nancy L. (36), Yousif, Bassam (33), Sayre, Edward A. (32), Powell, Eve Troutt (31), Ferguson, Michael (29), Hooglund, Eric (28), Bahramitash, Roksana (27), Pfeifer, Karen (26), Esfahani, Hadi Salehi (26), Starr, Deborah (24), Arjmand, Reza (22), Ackfeldt, Anders (21), Sorek, Tamir (21), Janson, Torsten (21).
Group 32 (98 members)
The community has 98 members (1.908%). The most salient features of the community are as follows:
- Disciplines: Literature (16);
- Subfields: Gender/Women’s Studies (22), Middle East/Near East Studies (21), Cultural Studies (16), Ethnic American Studies (15), Islamic Studies (15);
- Geographical focus: All Middle East (21), North America (13);
- Languages of expertise: Arabic (52), French (29), English (23);
- Members have degrees from: U Michigan (16), Georgetown U (8), Leiden U (6), U Chicago (6), North Carolina State U (6), UC, Davis (4), Northwestern U (4), Wayne State U (4), Syracuse U (4), U Bonn (4), U Oxford (4), Harvard U (4);
- Most active members are: Stephan, Rita (84), Vinson, Pauline Homsi (65), Cainkar, Louise A. (50), Kayyali, Randa (49), Saylor, Elizabeth (44), Ryad, Umar (37), Khalil, Mohammad H. (36), Jung, Dietrich (31), Hassan, Salah D. (30), Marzouki, Nadia (27), Rezai, Hamid (27), Hatem, Mervat (25), Afsaruddin, Asma (25).
Group 21 (87 members)
The community has 87 members (1.694%). The most salient features of the community are as follows:
- Disciplines: History (19);
- Subfields: Iranian Studies (37), Middle East/Near East Studies (25), Turkish Studies (17), Foreign Relations (13), Cultural Studies (13);
- Geographical focus: Iran (38), Turkey (22), All Middle East (22), Europe (10), Islamic World (9), Central Asia (9);
- Languages of expertise: Persian (39);
- Members have degrees from: Bilkent U (16), UT, Austin (12), UC, Los Angeles (10), U Copenhagen (10), Middle East Technical U (8), Johns Hopkins U (6), U Virginia (6), Istanbul U (6);
- Most active members are: Ehsani, Kaveh (76), Harris, Kevan (53), Schayegh, Cyrus (49), Evered, Kyle T. (49), Moruzzi, Norma Claire (42), Baghoolizadeh, Beeta (40), Helicke, James (40), Goode, James F. (40), Atalan-Helicke, Nurcan (40), Homayounvash, Mohammad (31), Kuzmanovic, Daniella (30), Mesbahi, Mohiaddin (26), Atabaki, Touraj (26), Oladi, Samaneh (26), Koyagi, Mikiya (24).
Group 25 (73 members)
The community has 72 members (1.402%). The most salient features of the community are as follows:
- Disciplines: Political Science (20);
- Subfields: Middle East/Near East Studies (20), Arab-Israeli Conflict (18), Comparative (13), 19th-21st Centuries (12);
- Geographical focus: Israel (15), Palestine (14), All Middle East (14);
- Languages of expertise: Arabic (38);
- Members have degrees from: Sabanci U (12), Tel-Aviv U (10), UC, Los Angeles (10), Georgetown U (8), Yale U (8), Columbia U (6), London School Economics (6), George Washington U (6), Boğaziçi U (6);
- Most active members are: Freedman, Robert O. (75), Zisser, Eyal (47), Peleg, Ilan (40), Rabi, Uzi (35), Daadaoui, Mohamed (34), Nikpour, Golnar (33), Teitelbaum, Joshua (30), Ginat, Rami (28), Daoud, Suheir Abu Oksa (24), Schorn, Timothy (22).
Group 26 (68 members)
The community has 68 members (1.324%). The most salient features of the community are as follows:
- Disciplines: History (17), Anthropology (9);
- Subfields: Middle East/Near East Studies (18), Assyrian Studies (12), 19th-21st Centuries (8), Minorities (8);
- Geographical focus: Iraq (23), Syria (11), Turkey (10), Iran (10), All Middle East (10);
- Languages of expertise: Arabic (29), French (17);
- Members have degrees from: Harvard U (8), U Toronto (6), U Chicago (6), Tel-Aviv U (6), U Washington (6);
- Most active members are: Bashkin, Orit (85), Dawood, Fadi (65), Benjamen, Alda (51), Sassoon, Joseph (49), Donabed, Sargon (46), Bet-Shlimon, Arbella (37), Al-Jeloo, Nicholas (36), Guarasci, Bridget (32), Shields, Sarah D. (32), Saleh, Zainab (31).
Group 29 (62 members)
The community has 62 members (1.207%). The most salient features of the community are as follows:
- Disciplines: History (15);
- Subfields: Middle East/Near East Studies (16), Colonialism (16), 19th-21st Centuries (14), Arab-Israeli Conflict (13), Nationalism (11);
- Geographical focus: Palestine (19), Egypt (13), All Middle East (10), Israel (8);
- Languages of expertise: Arabic (38), French (25);
- Members have degrees from: New York U (22), Georgetown U (10), Harvard U (8), Oxford U (8), Princeton U (6), UC, Berkeley (6);
- Most active members are: Seikaly, Sherene (107), Williams, Elizabeth (73), Hajjar, Lisa (63), Jakes, Aaron G. (60), Ragab, Ahmed (51), Derr, Jennifer (47), Brand, Laurie (47), Bali, Asli (37).
Group 18 (57 members)
The community has 57 members (1.11%). The most salient features of the community are as follows:
- Disciplines: ();
- Subfields: Middle East/Near East Studies (17), Arab Studies (13), 19th-21st Centuries (11), Cultural Studies (11), Identity/Representation (11), Iranian Studies (8), Arab-Israeli Conflict (8);
- Geographical focus: Palestine (14), Lebanon (11), All Middle East (10);
- Languages of expertise: Arabic (37), French (28);
- Members have degrees from: Indiana U (12), U Michigan (6), U Chicago (6), New York U (6), U Wisconsin, Madison (6);
- Most active members are: Shabout, Nada M. (46), Scheid, Kirsten (40), Al-Bahloly, Saleem (34), Lenssen, Anneka (26), Strohm, Kiven (25), Marks, Laura (21).
-
Photo by Robin Dougherty, source: www.facebook.com. ↩