10 Lesson 10: Graphing Chronological Distribution of Tagged Entities
10.1 Abstractions of Newspaper Articles
In the previous lesson we created abstractions of our newspaper articles. Namely, we reduced the text in natural languages to mentions of places, persons, and organizations. Together, they give us an idea of the main actors (persons and organizations), i.e. who is involved in some developments described in each article, and main locations (placenames) of where these developments took place.
ID: 1864-04-28_article_002
DATE: 1864-04-28
TYPE: article
HEADER: Yankee rule in Plymouth.
TEXT: Yankee rule in Plymouth.<br> The following orders are copies of hand-bills
  posted in the town of Plymouth.<br> It will be seen that Brig. Gen. Wessels is
  a model after Lincoln 's own heart, and undertook to "run the churches" and
  the schools besides.<br> As we find the names of the General and the Provost
  Marshal, and the A. A., G.'s on the register of the Libby Hotel, in this city,
  it is more than likely that the children "between eight and fourteen" in
  Plymouth are having a cheerful vacation, and that Col. Moffitt will refrain
  for the present from the disagreeable duty of reporting the derelict heads of
  families who don't enforce their attendance.<br> This is the school order<br>
  Notice.<br> The inhabitants of Plymouth are hereby notified that a Free school,
  for white children, will be spend under competent teachers,<br> On Monday, 18th
  inst,<br> in the Episcopal Church.<br> The attention of parents and guardians
  is called in this important subject; and it is expected that all children
  between eight and fourteen years of age will attend the school.<br> Those over
  fourteen may attend if they wish.<br> Lieut. Col. Moffitt, Provost Marshal,
  will institute careful inquiries, and report such families as neglect to avail
  themselves of the advantages thus offered. By command of Brig. Gen. H. W.
  Wessels, Andrew Stewart, Assistant Adjutant General. Plymouth, N. C., April
  14th, 1864.<br> And this is the order for running the churches<br> Notice<br>
  Until further orders church call will be sounded at the Provost Guard on
  Sundays, at fifteen minutes before 11 A. M., and at 2.15 P. M. the call to be
  repeated promptly by the drums of the several regiments and detachments.<br>
  The annoyance caused by entering and leaving the churches during the
  performance of Divine service, and by the practice of spitting on the floor
  is excessive, and it is hoped that these evils will be corrected without the
  necessity of individual reproof. By order of Brig. Gen. H. W. Wessels, D. F.
  Beegle, Lieut, A. D. C. & A. A. A. G. Plymouth, N. C, April 11th, 1864.
Thus, the article above (1864-04-28_article_002) can be abstracted to the following data (here, based exclusively on entities already tagged in the initial XML documents):
| articleID | date | itemType | itemUnified | itemId |
|---|---|---|---|---|
| 1864-04-28_article_002 | 1864-04-28 | placename | plymouth, washington, north carolina | tgn,2076159 |
| 1864-04-28_article_002 | 1864-04-28 | placename | plymouth, washington, north carolina | tgn,2076159 |
| 1864-04-28_article_002 | 1864-04-28 | persname | wessels,brigadier-general,,,, | wessels,h.,w. |
| 1864-04-28_article_002 | 1864-04-28 | persname | lincoln,,,,, | lincoln |
| 1864-04-28_article_002 | 1864-04-28 | placename | plymouth, washington, north carolina | tgn,2076159 |
| 1864-04-28_article_002 | 1864-04-28 | persname | moffitt,colonel,,,, | moffitt |
| 1864-04-28_article_002 | 1864-04-28 | placename | plymouth, washington, north carolina | tgn,2076159 |
| 1864-04-28_article_002 | 1864-04-28 | orgname | free school | school |
| 1864-04-28_article_002 | 1864-04-28 | orgname | episcopal church | church |
| 1864-04-28_article_002 | 1864-04-28 | persname | moffitt,lieutenant-colonel,,,, | moffitt |
| 1864-04-28_article_002 | 1864-04-28 | persname | wessels,brigadier-general,h.,w.,, | wessels,h.,w. |
| 1864-04-28_article_002 | 1864-04-28 | persname | stewart,,andrew,,, | stewart,andrew |
| 1864-04-28_article_002 | 1864-04-28 | placename | plymouth, washington, north carolina | tgn,2076159 |
| 1864-04-28_article_002 | 1864-04-28 | orgname | provost guard | guard |
| 1864-04-28_article_002 | 1864-04-28 | persname | wessels,brigadier-general,h.,w.,, | wessels,h.,w. |
| 1864-04-28_article_002 | 1864-04-28 | persname | beegle,,d.,f.,, | beegle,d.,f. |
| 1864-04-28_article_002 | 1864-04-28 | placename | plymouth, washington, north carolina | tgn,2076159 |
Such abstractions can never fully replace the close reading of text, but they open up possibilities of distant reading of the entire corpus of our newspaper. For example, we can measure the frequencies of mentions of specific entities over time in order to assess their prominence and importance across the entire period as well as to identify specific moments in time, when they (people, places, organizations/institutions) soared to some level of importance. Additionally, we can also assess how traditional reading can be reinforces or informed by distant reading. Let’s now take a look at a couple of simple examples. (After which we will take a look at the code and you will get an assignment to modify it.)
Example 1: General Sherman and the burning of Atlanta
William Tecumseh Sherman was a Union General serving under the command of Ulysses Grant during the Civil War. He is most known for his campaign through Georgia and the Carolinas in 1864 where he followed a scorched earth policy including the capture and burning of Atlanta. During the Grant Presidency, Sherman became Commanding General of the Army, formulating the military response to the conflict with Indian tribes in the west.
Source: Lloyd Sealy Library — Key Personolities of the Civil War
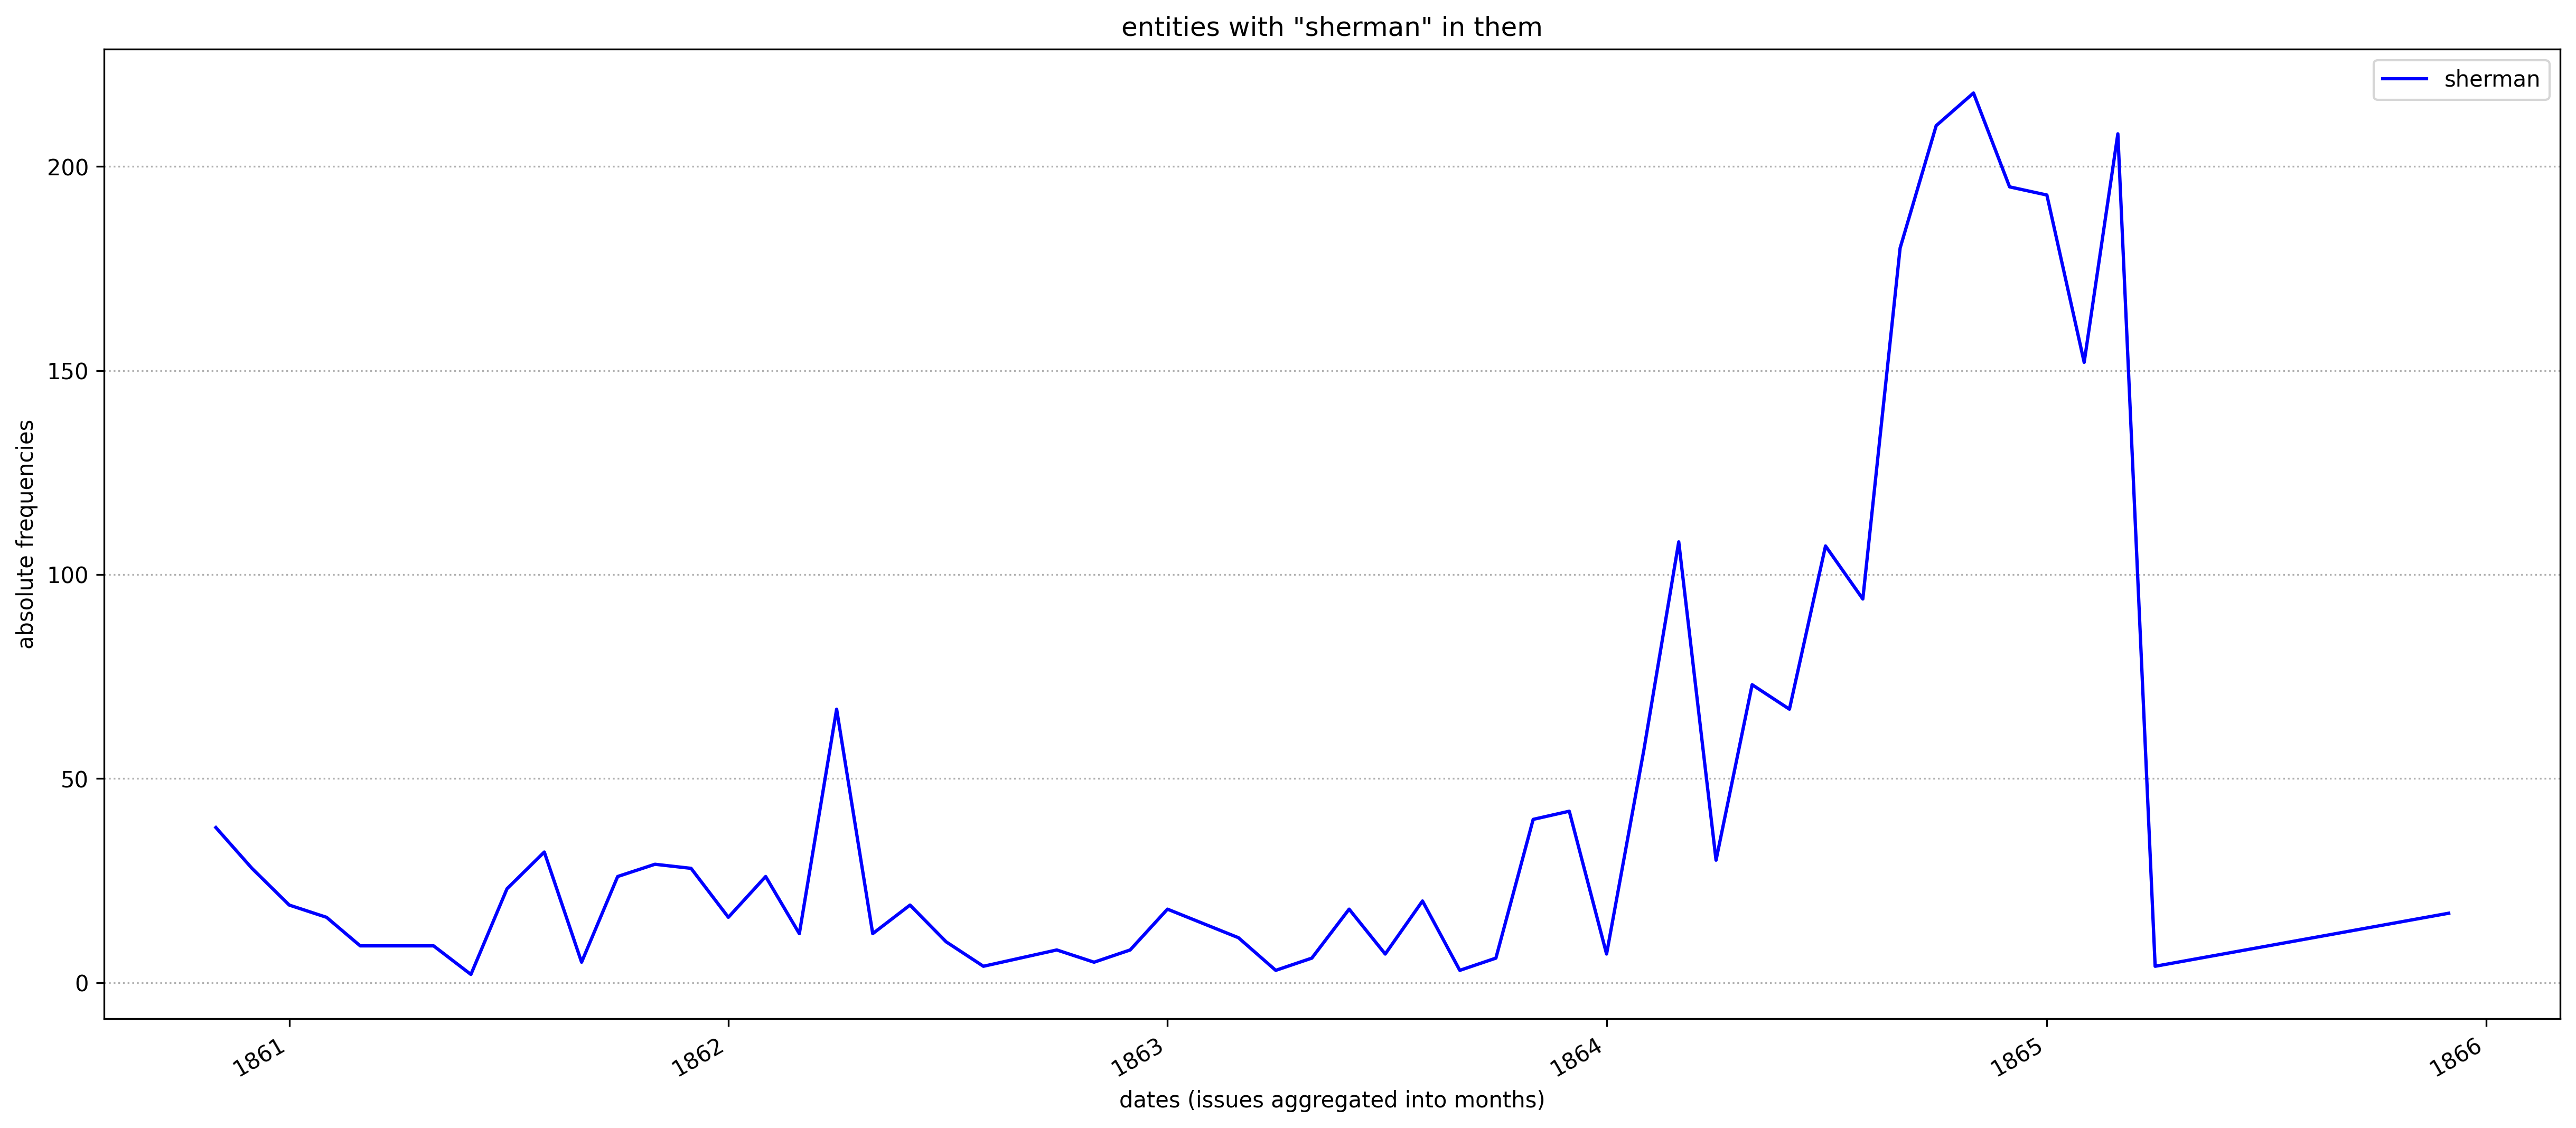
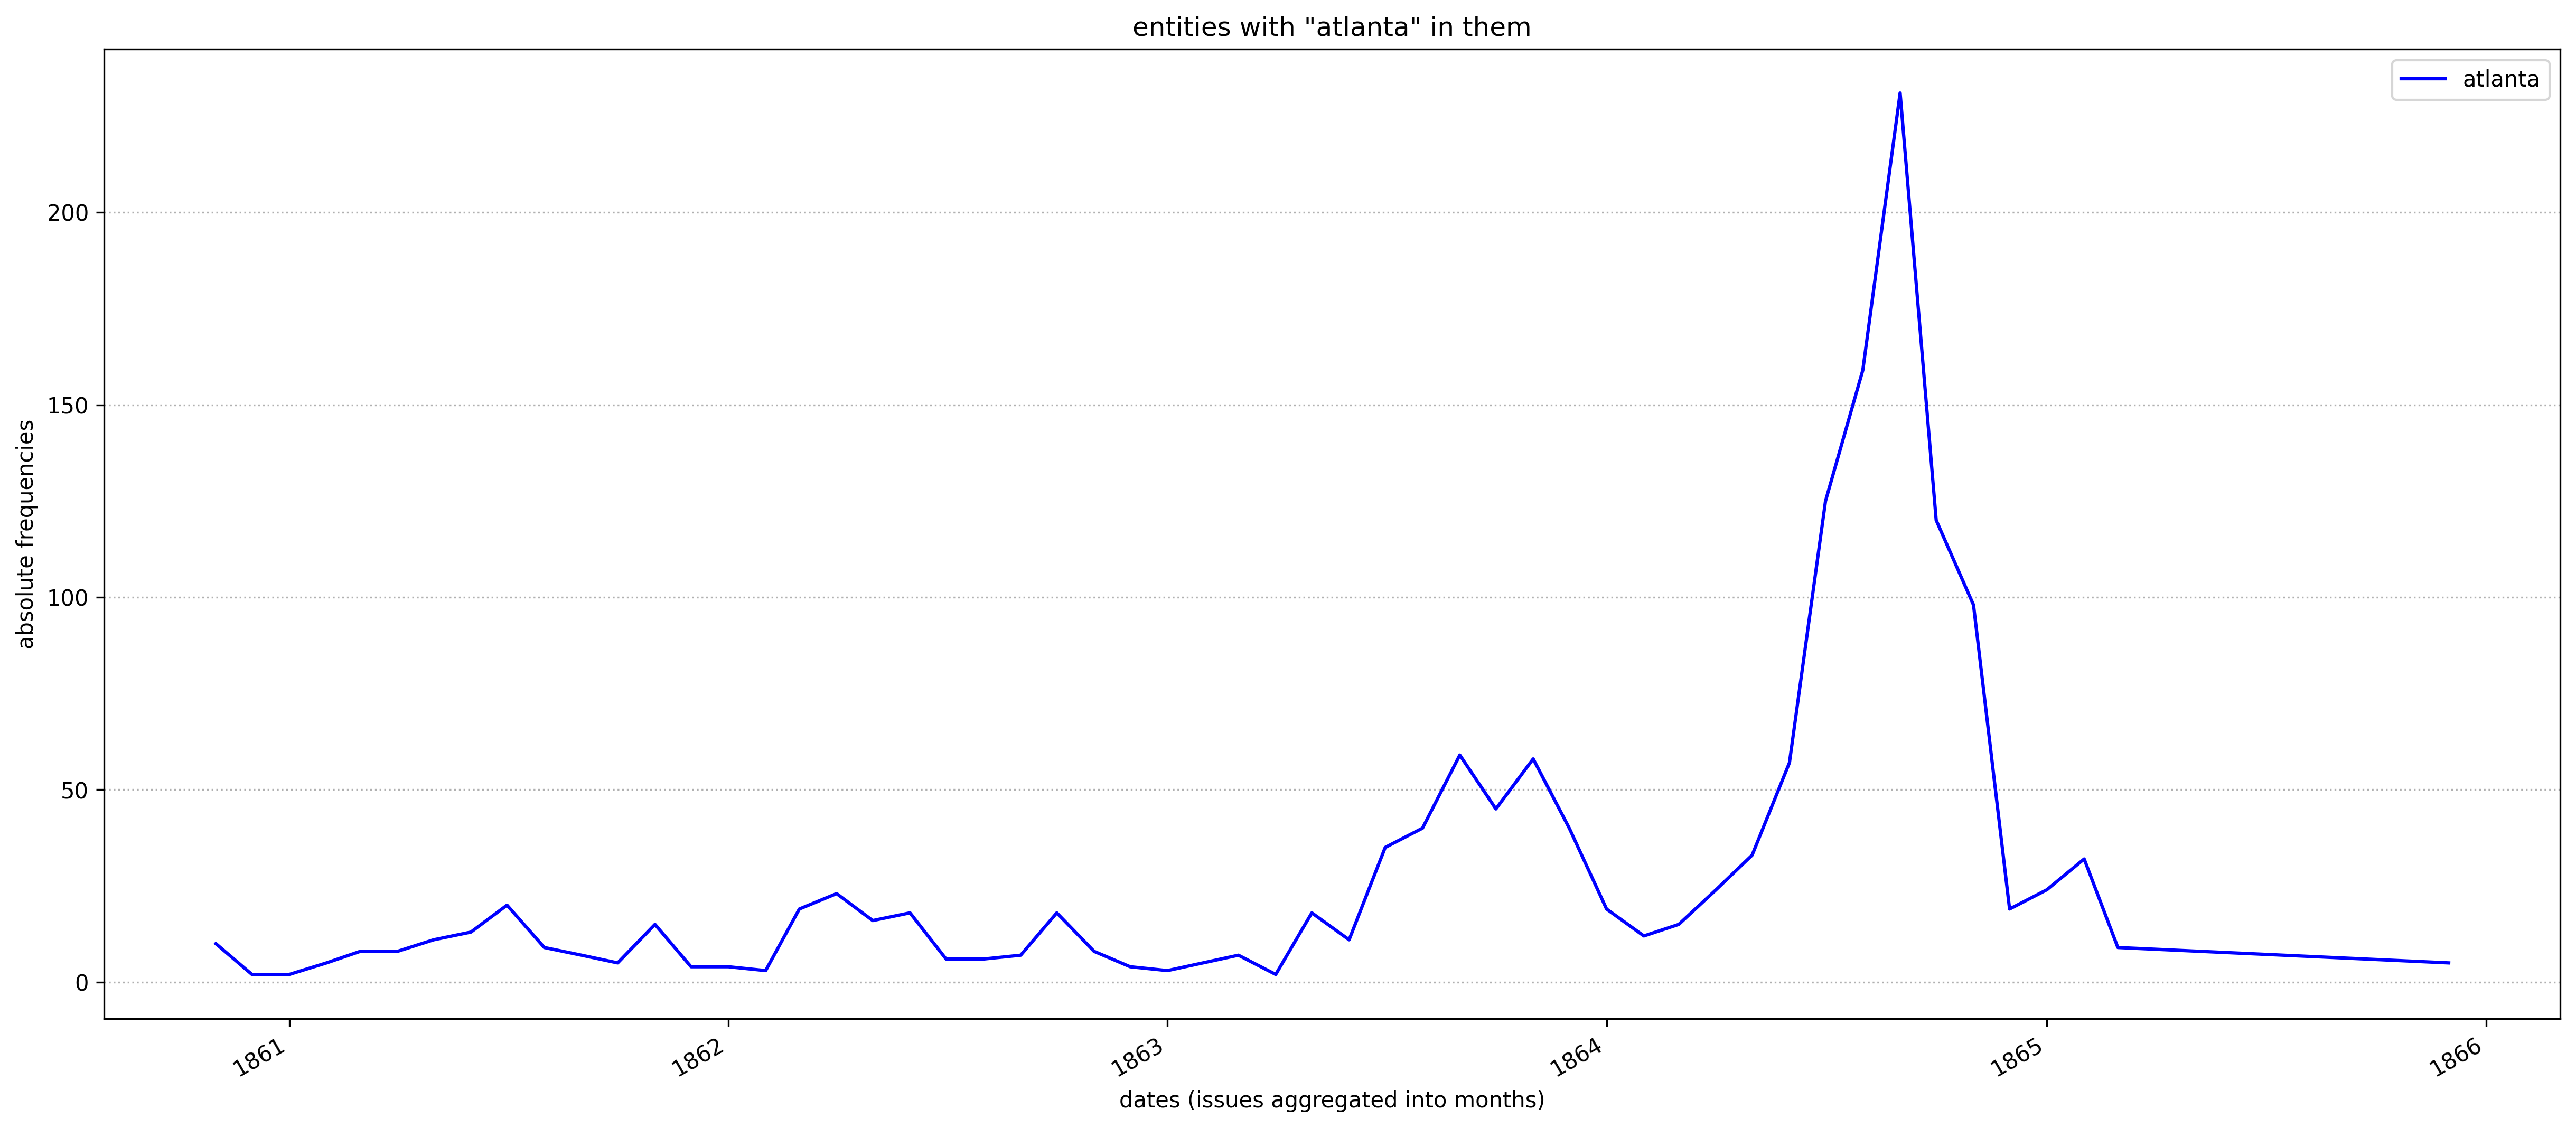
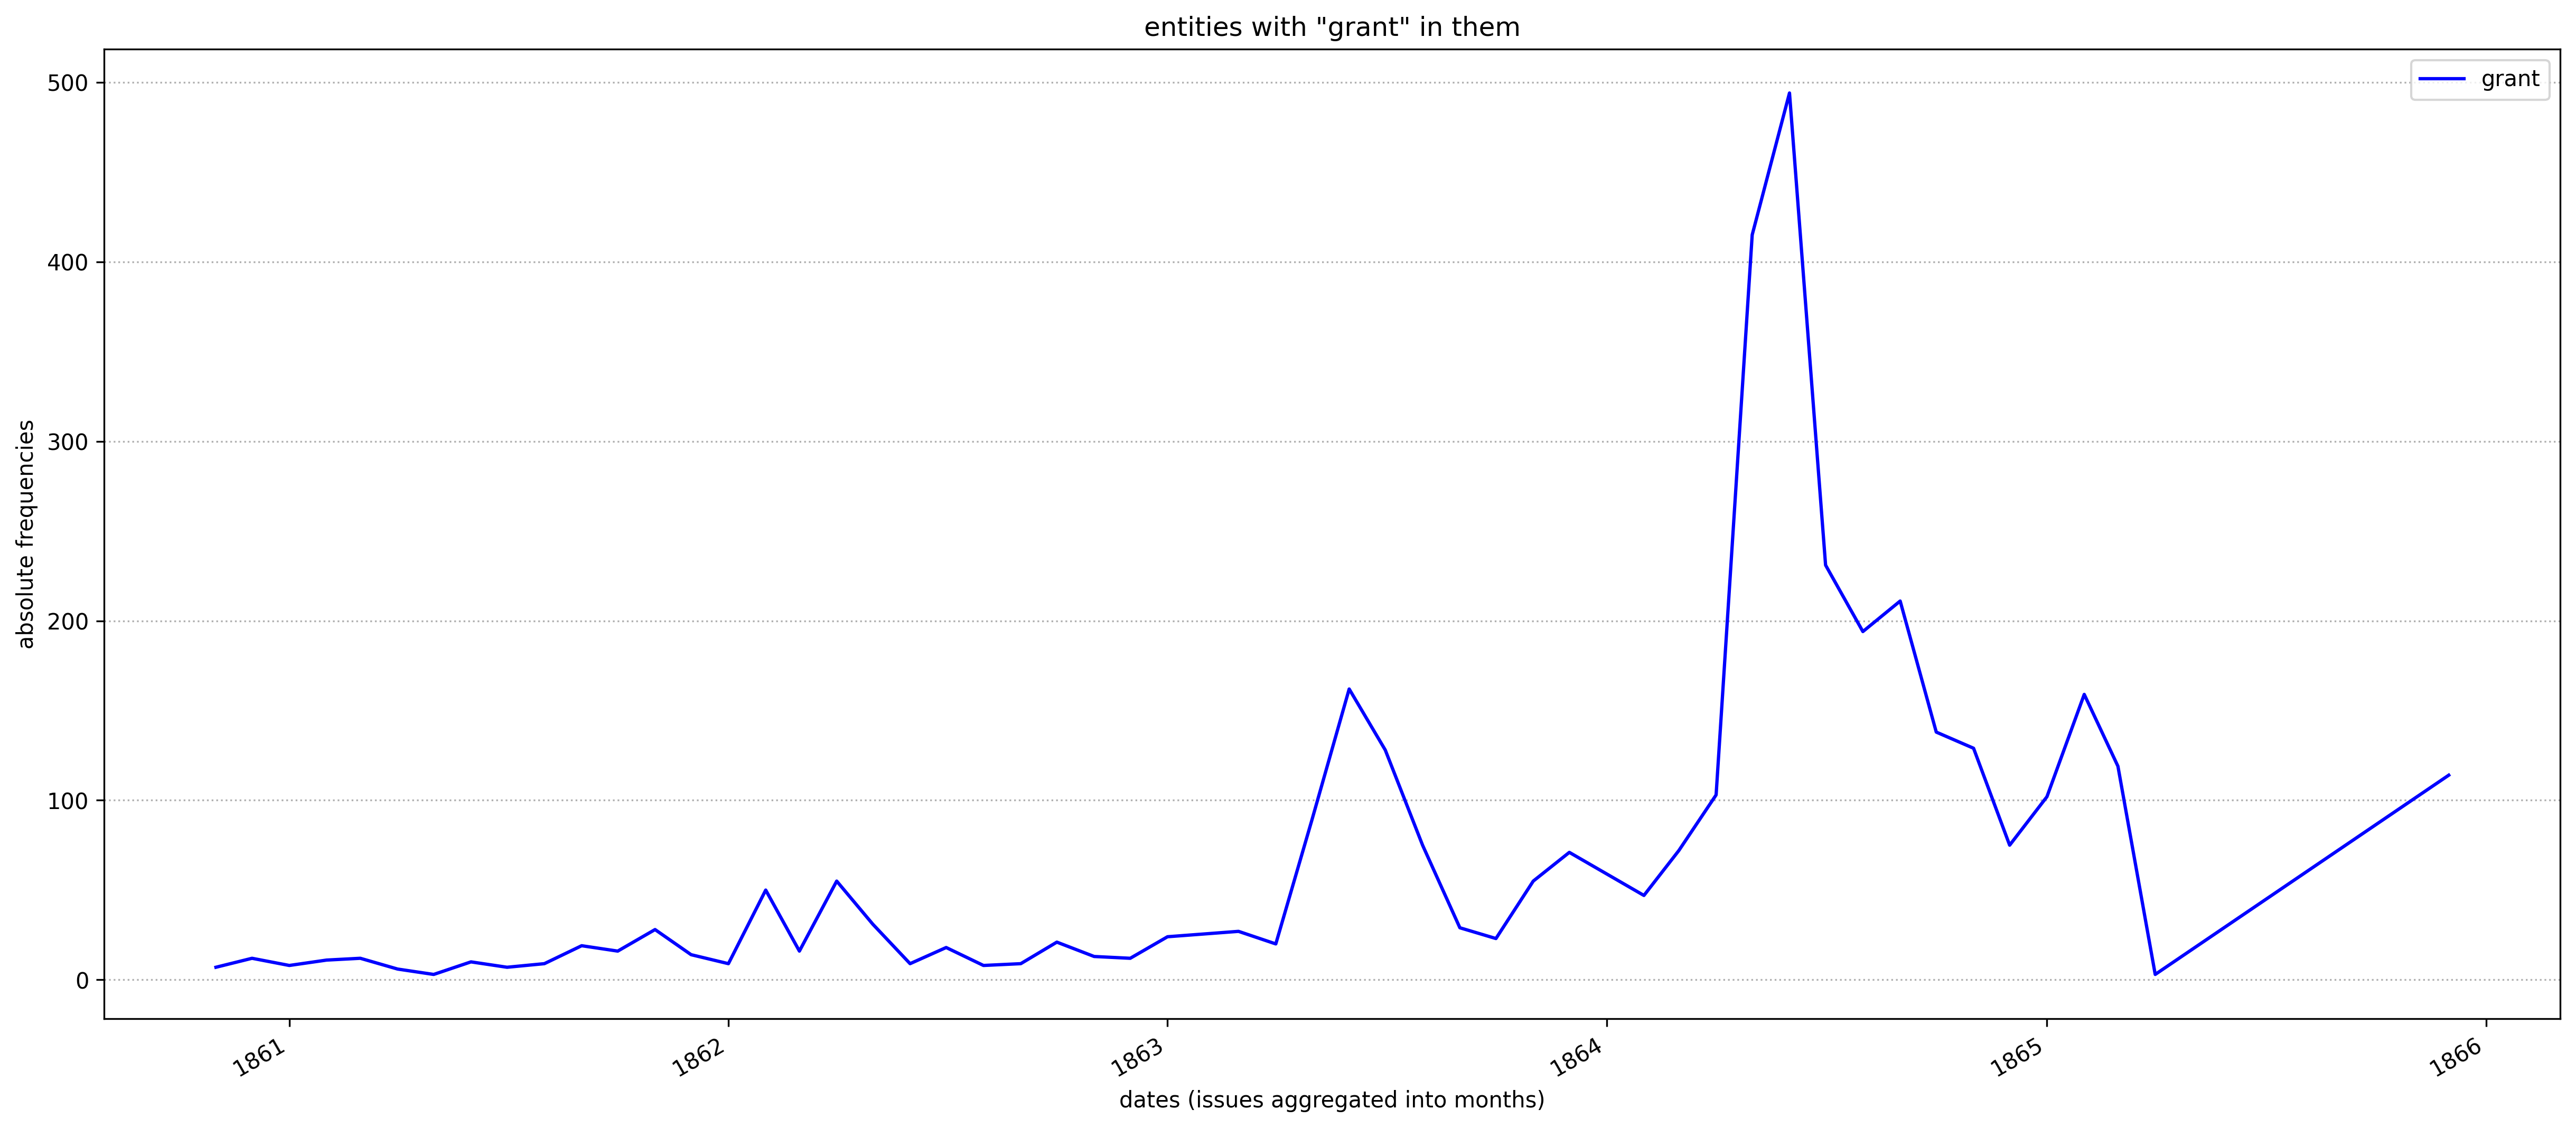
The two graphs below show mentions of both sherman and atlanta in the Dispatch issues: there we can see/show how the prominence of William Sherman went up in the course of his campaign in 1864, while the spike in mentions of Atlanta must reflect the capture and burning of the city.
Example 2. The Battle of Shiloh (April 6–7, 1862)
The Battle of Shiloh (also known as the Battle of Pittsburg Landing) was an early battle in the Western Theater of the American Civil War, fought April 6–7, 1862, in southwestern Tennessee. The Union Army of the Tennessee (Major General Ulysses S. Grant) had moved via the Tennessee River deep into Tennessee and was encamped principally at Pittsburg Landing on the west bank of the Tennessee River, where the Confederate Army of Mississippi (General Albert Sidney Johnston, P. G. T. Beauregard second-in-command) launched a surprise attack on Grant’s army from its base in Corinth, Mississippi. Johnston was mortally wounded during the fighting; Beauregard took command of the army and decided against pressing the attack late in the evening. Overnight, Grant was reinforced by one of his divisions stationed farther north and was joined by three divisions from the Army of the Ohio (Maj. Gen. Don Carlos Buell). The Union forces began an unexpected counterattack the next morning which reversed the Confederate gains of the previous day. On April 6, the first day of the battle, the Confederates struck with the intention of driving the Union defenders away from the river and into the swamps of Owl Creek to the west. Johnston hoped to defeat Grant’s army before the anticipated arrival of Buell and the Army of the Ohio. The Confederate battle lines became confused during the fighting, and Grant’s men instead fell back to the northeast, in the direction of Pittsburg Landing. A Union position on a slightly sunken road, nicknamed the “Hornet’s Nest” and defended by the divisions of Brig. Gens. Benjamin Prentiss and William H. L. Wallace, provided time for the remainder of the Union line to stabilize under the protection of numerous artillery batteries. Wallace was mortally wounded when the position collapsed, while several regiments from the two divisions were eventually surrounded and surrendered. Johnston was shot in the leg and bled to death while leading an attack. Beauregard acknowledged how tired the army was from the day’s exertions, and decided against assaulting the final Union position that night. Tired but unfought and well-organized men from Buell’s army and a division of Grant’s army arrived in the evening of April 6 and helped turn the tide the next morning, when the Union commanders launched a counterattack along the entire line. Confederate forces were forced to retreat, ending their hopes of blocking the Union advance into northern Mississippi. Though victorious, the Union army had suffered heavier casualties than the Confederates, and Grant was heavily criticized in the media for being taken by surprise. The Battle of Shiloh was the bloodiest engagement of the Civil War up to that point, with nearly twice as many casualties as the previous major battles of the war combined.
Now, let’s take a look at the graphs for the names highlighted in bold above:
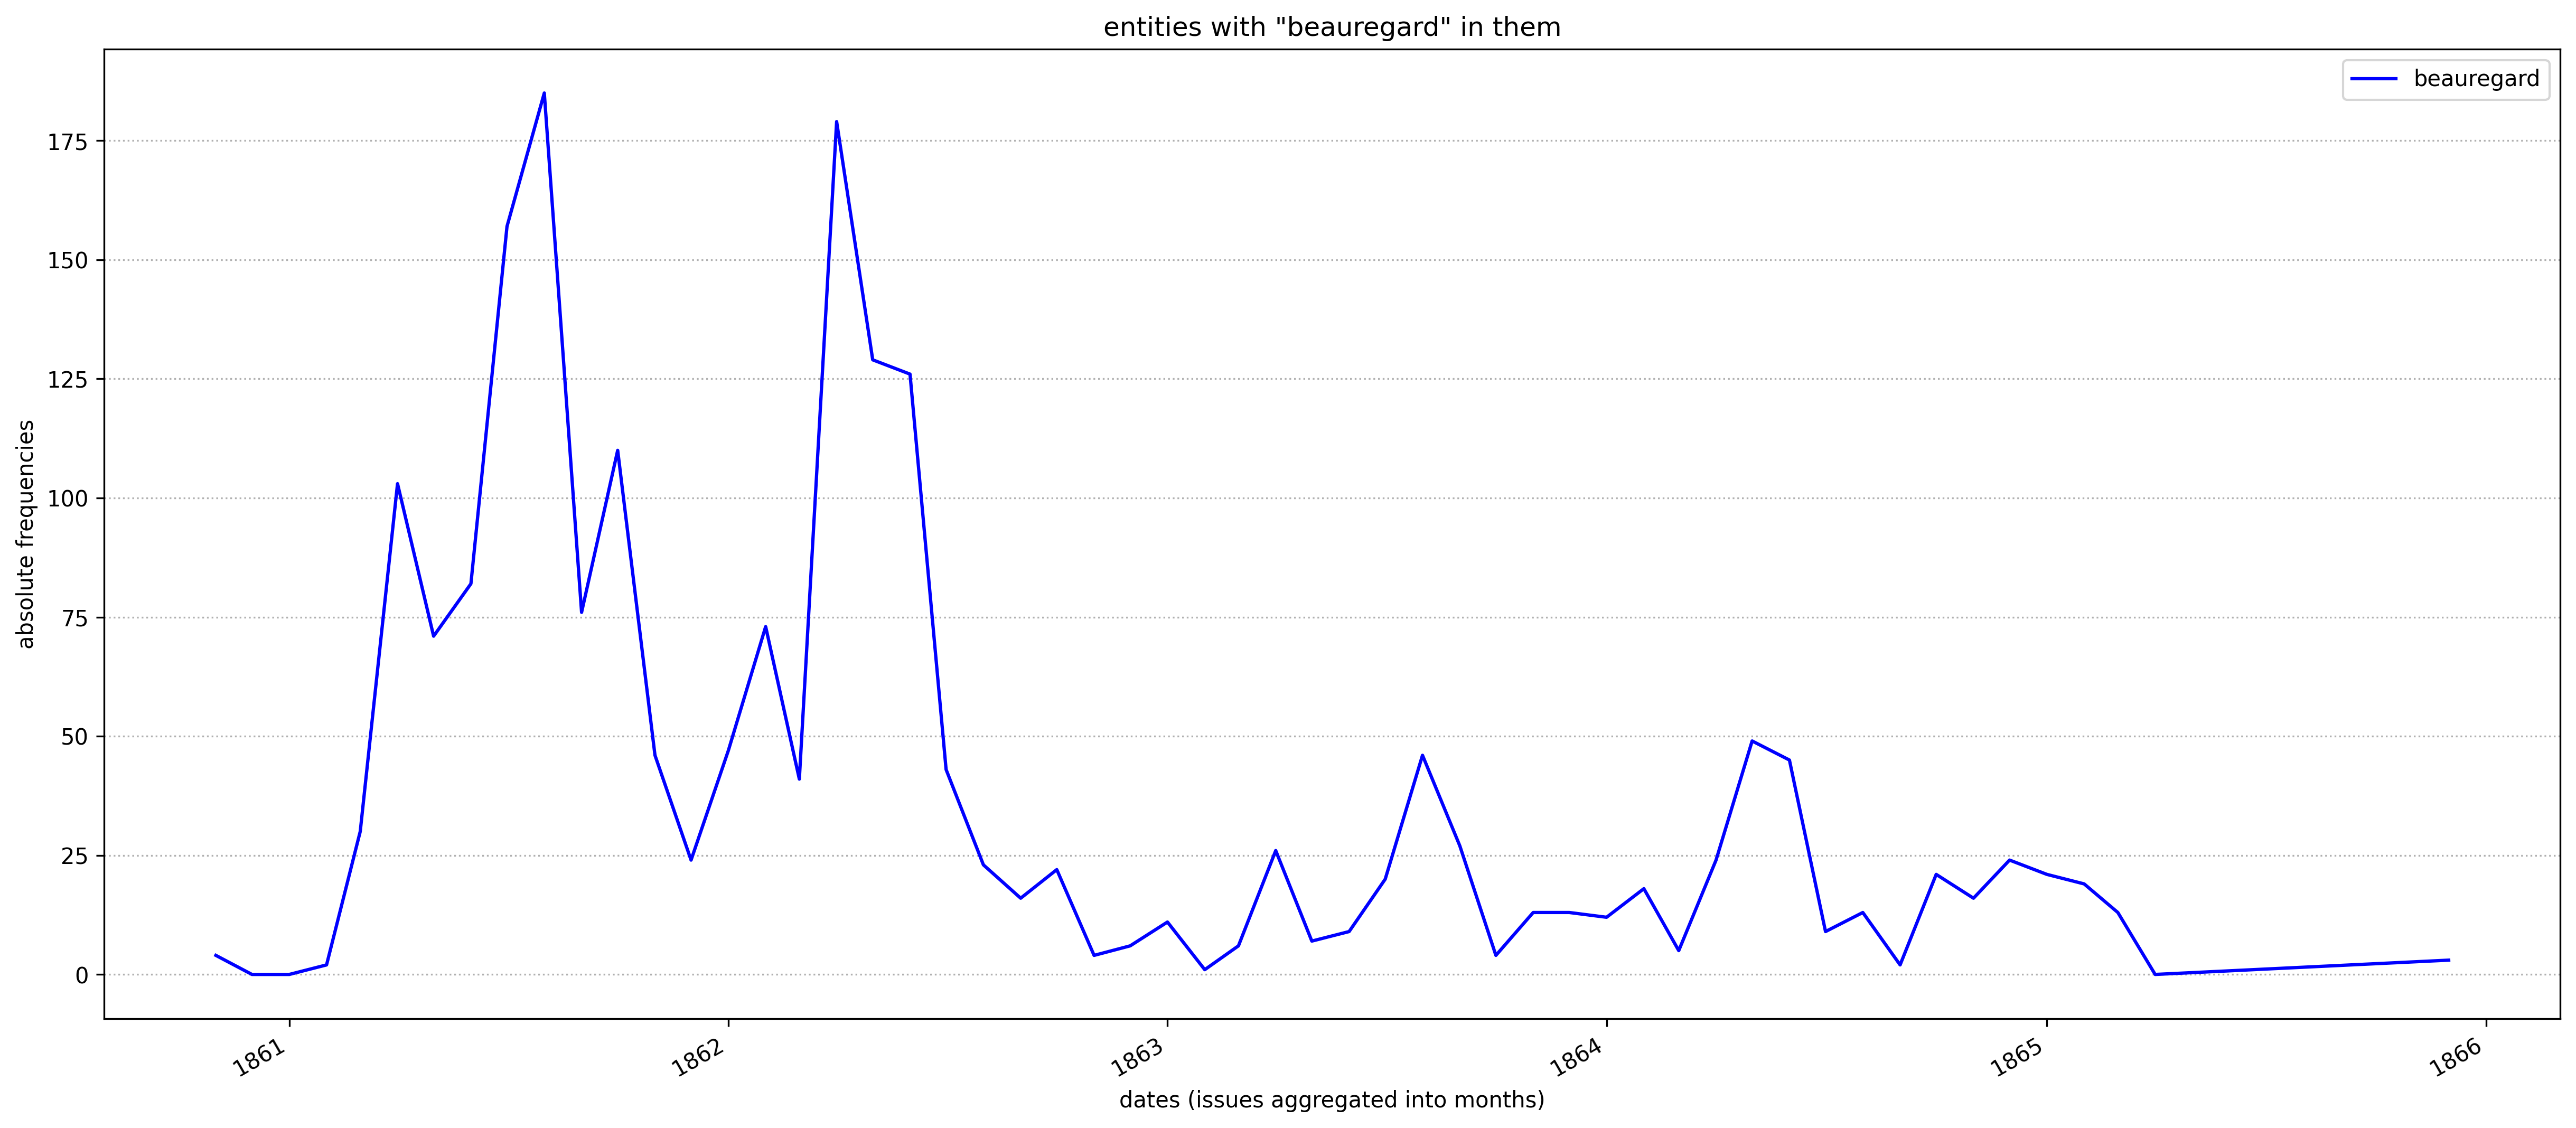
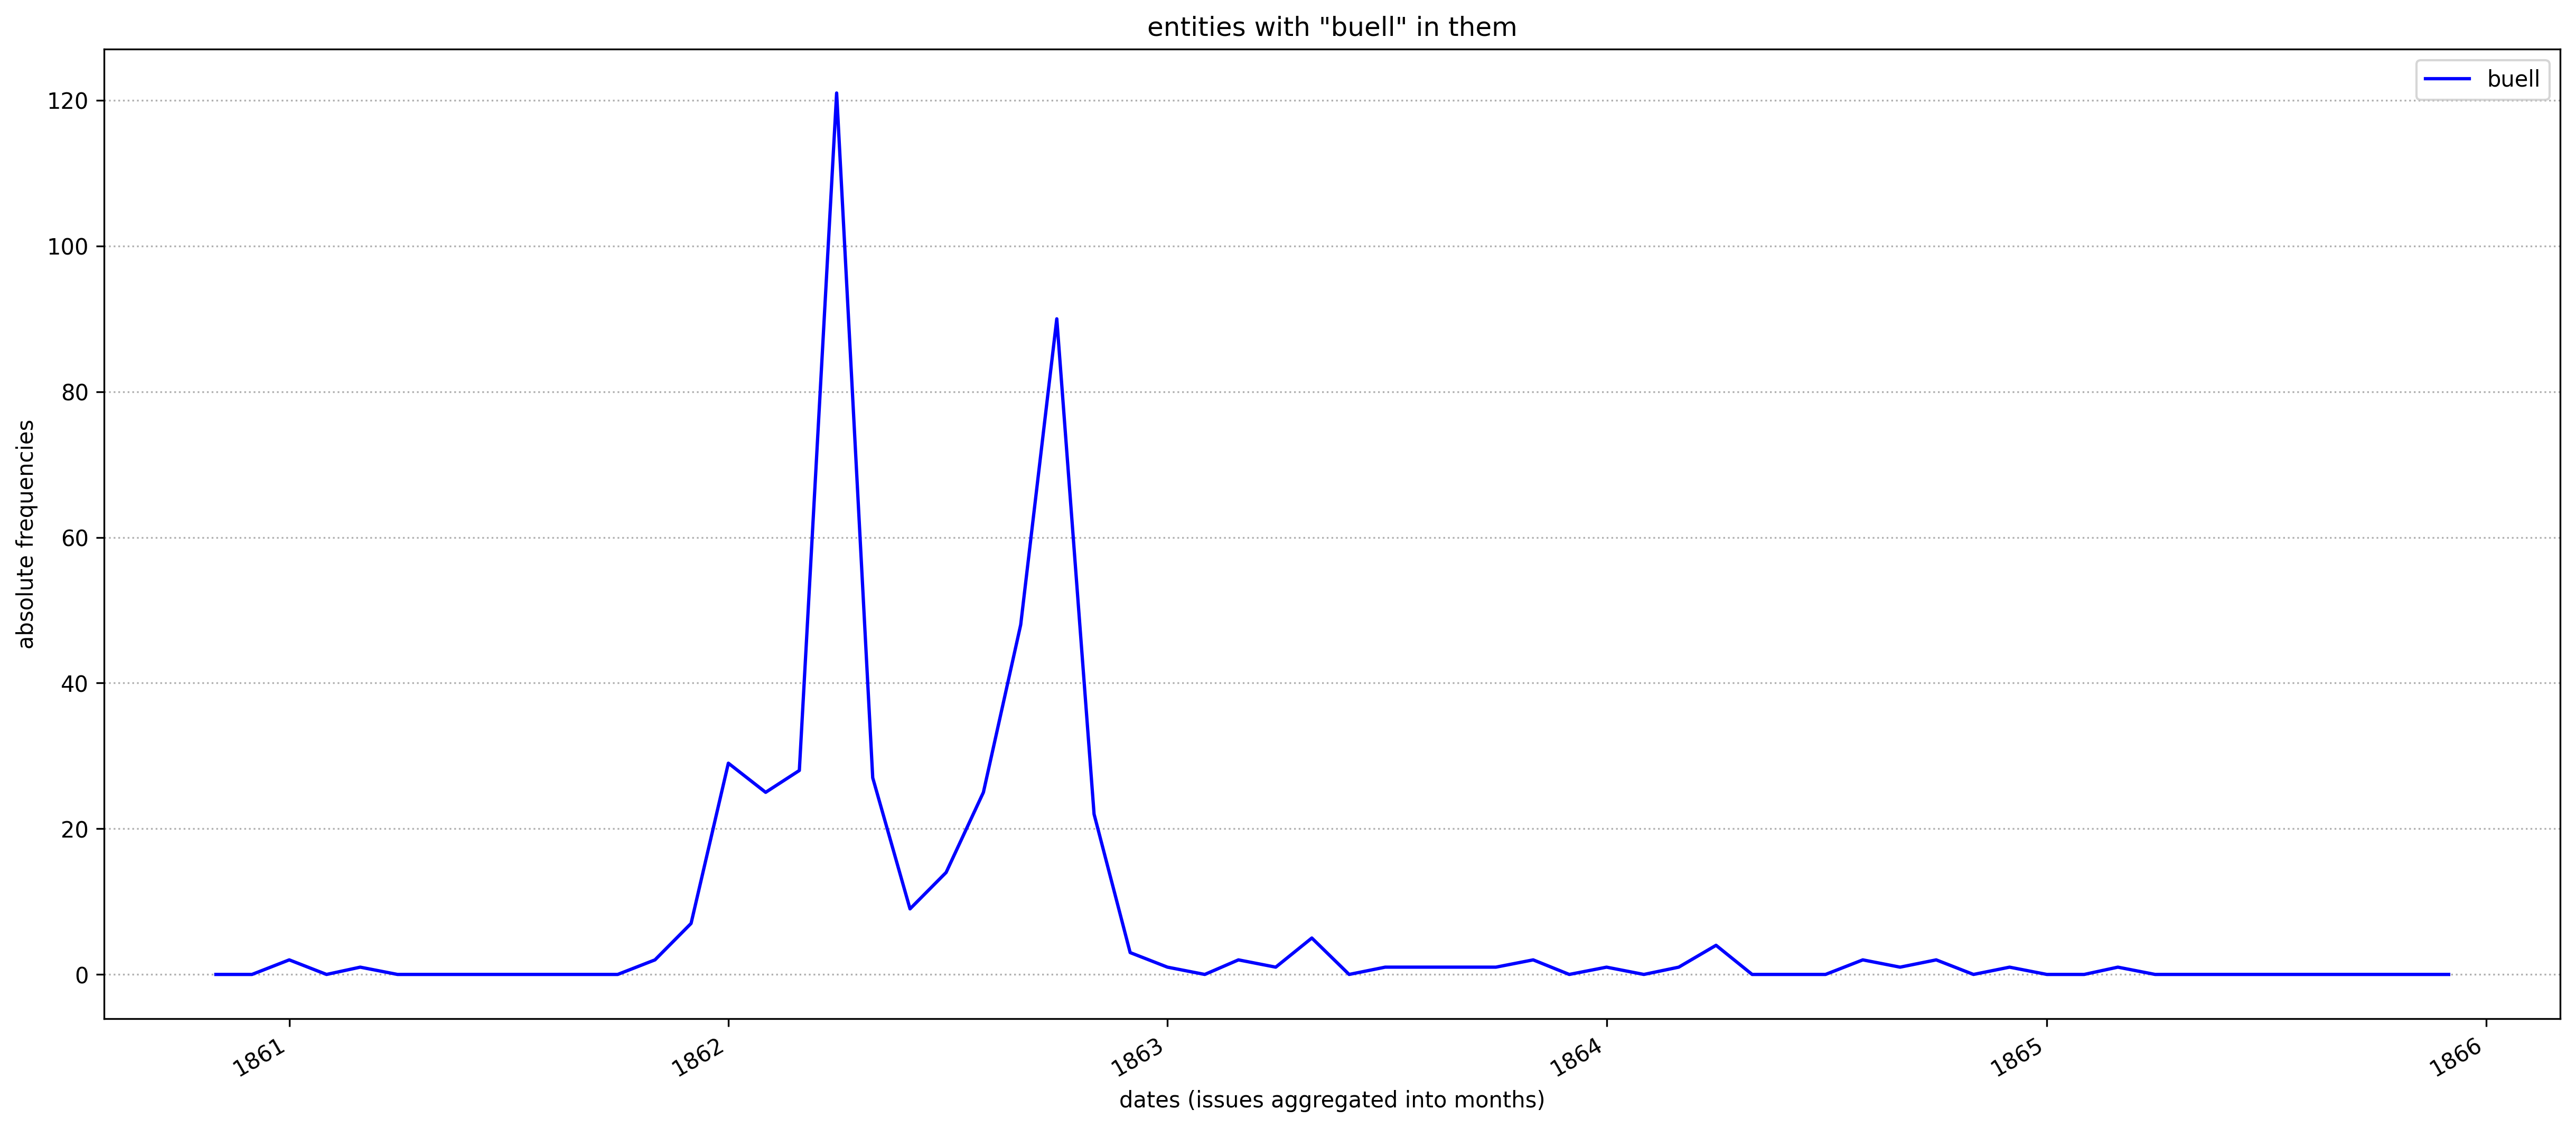
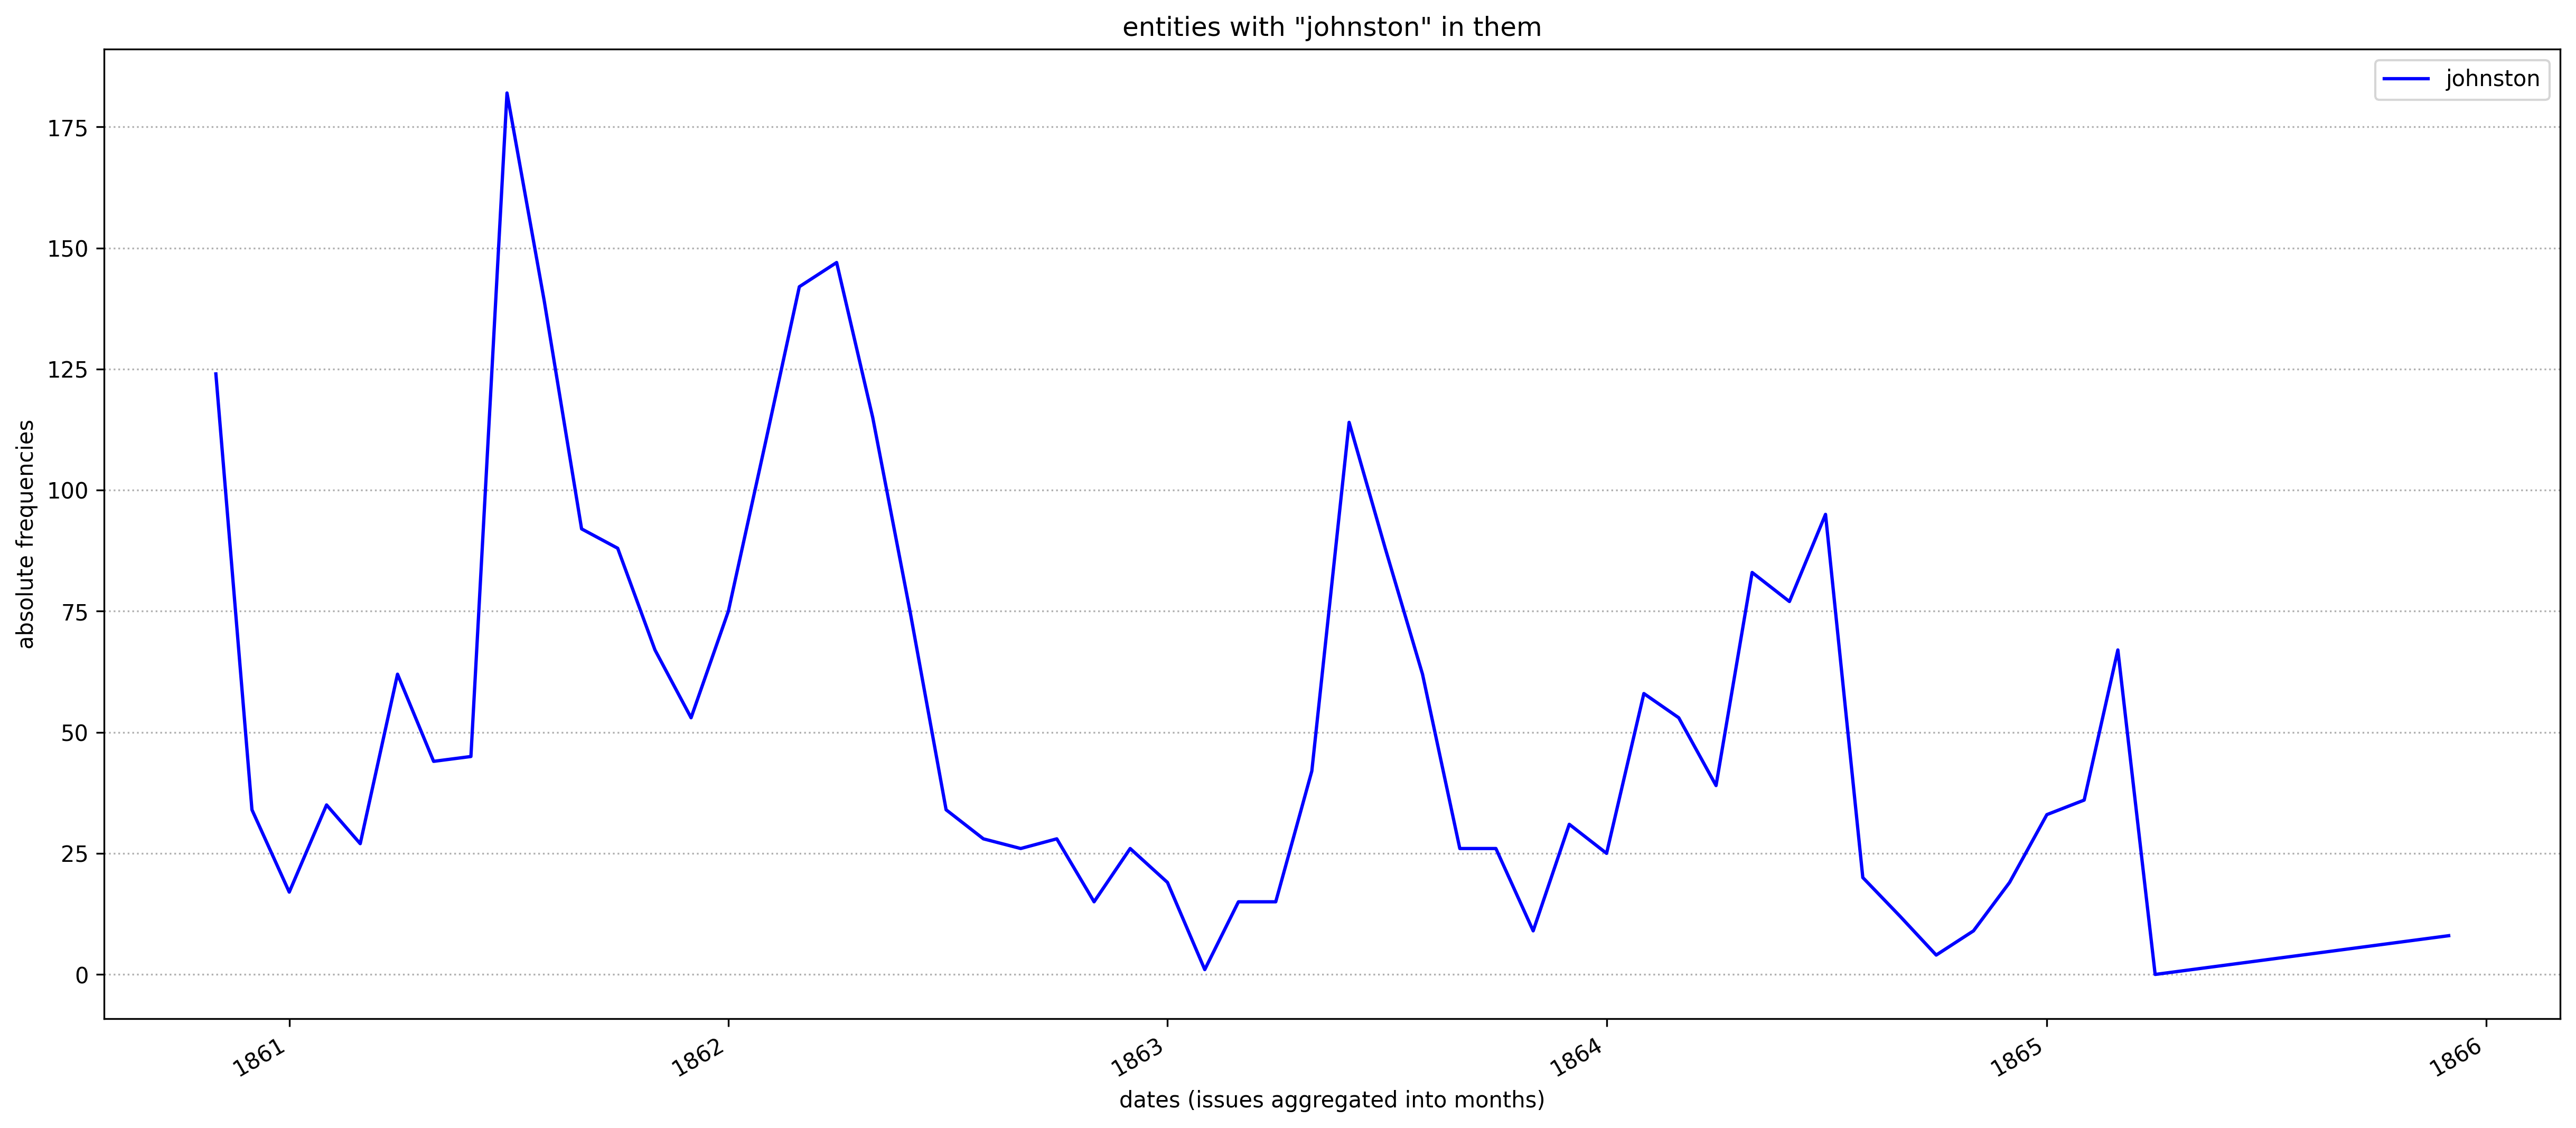
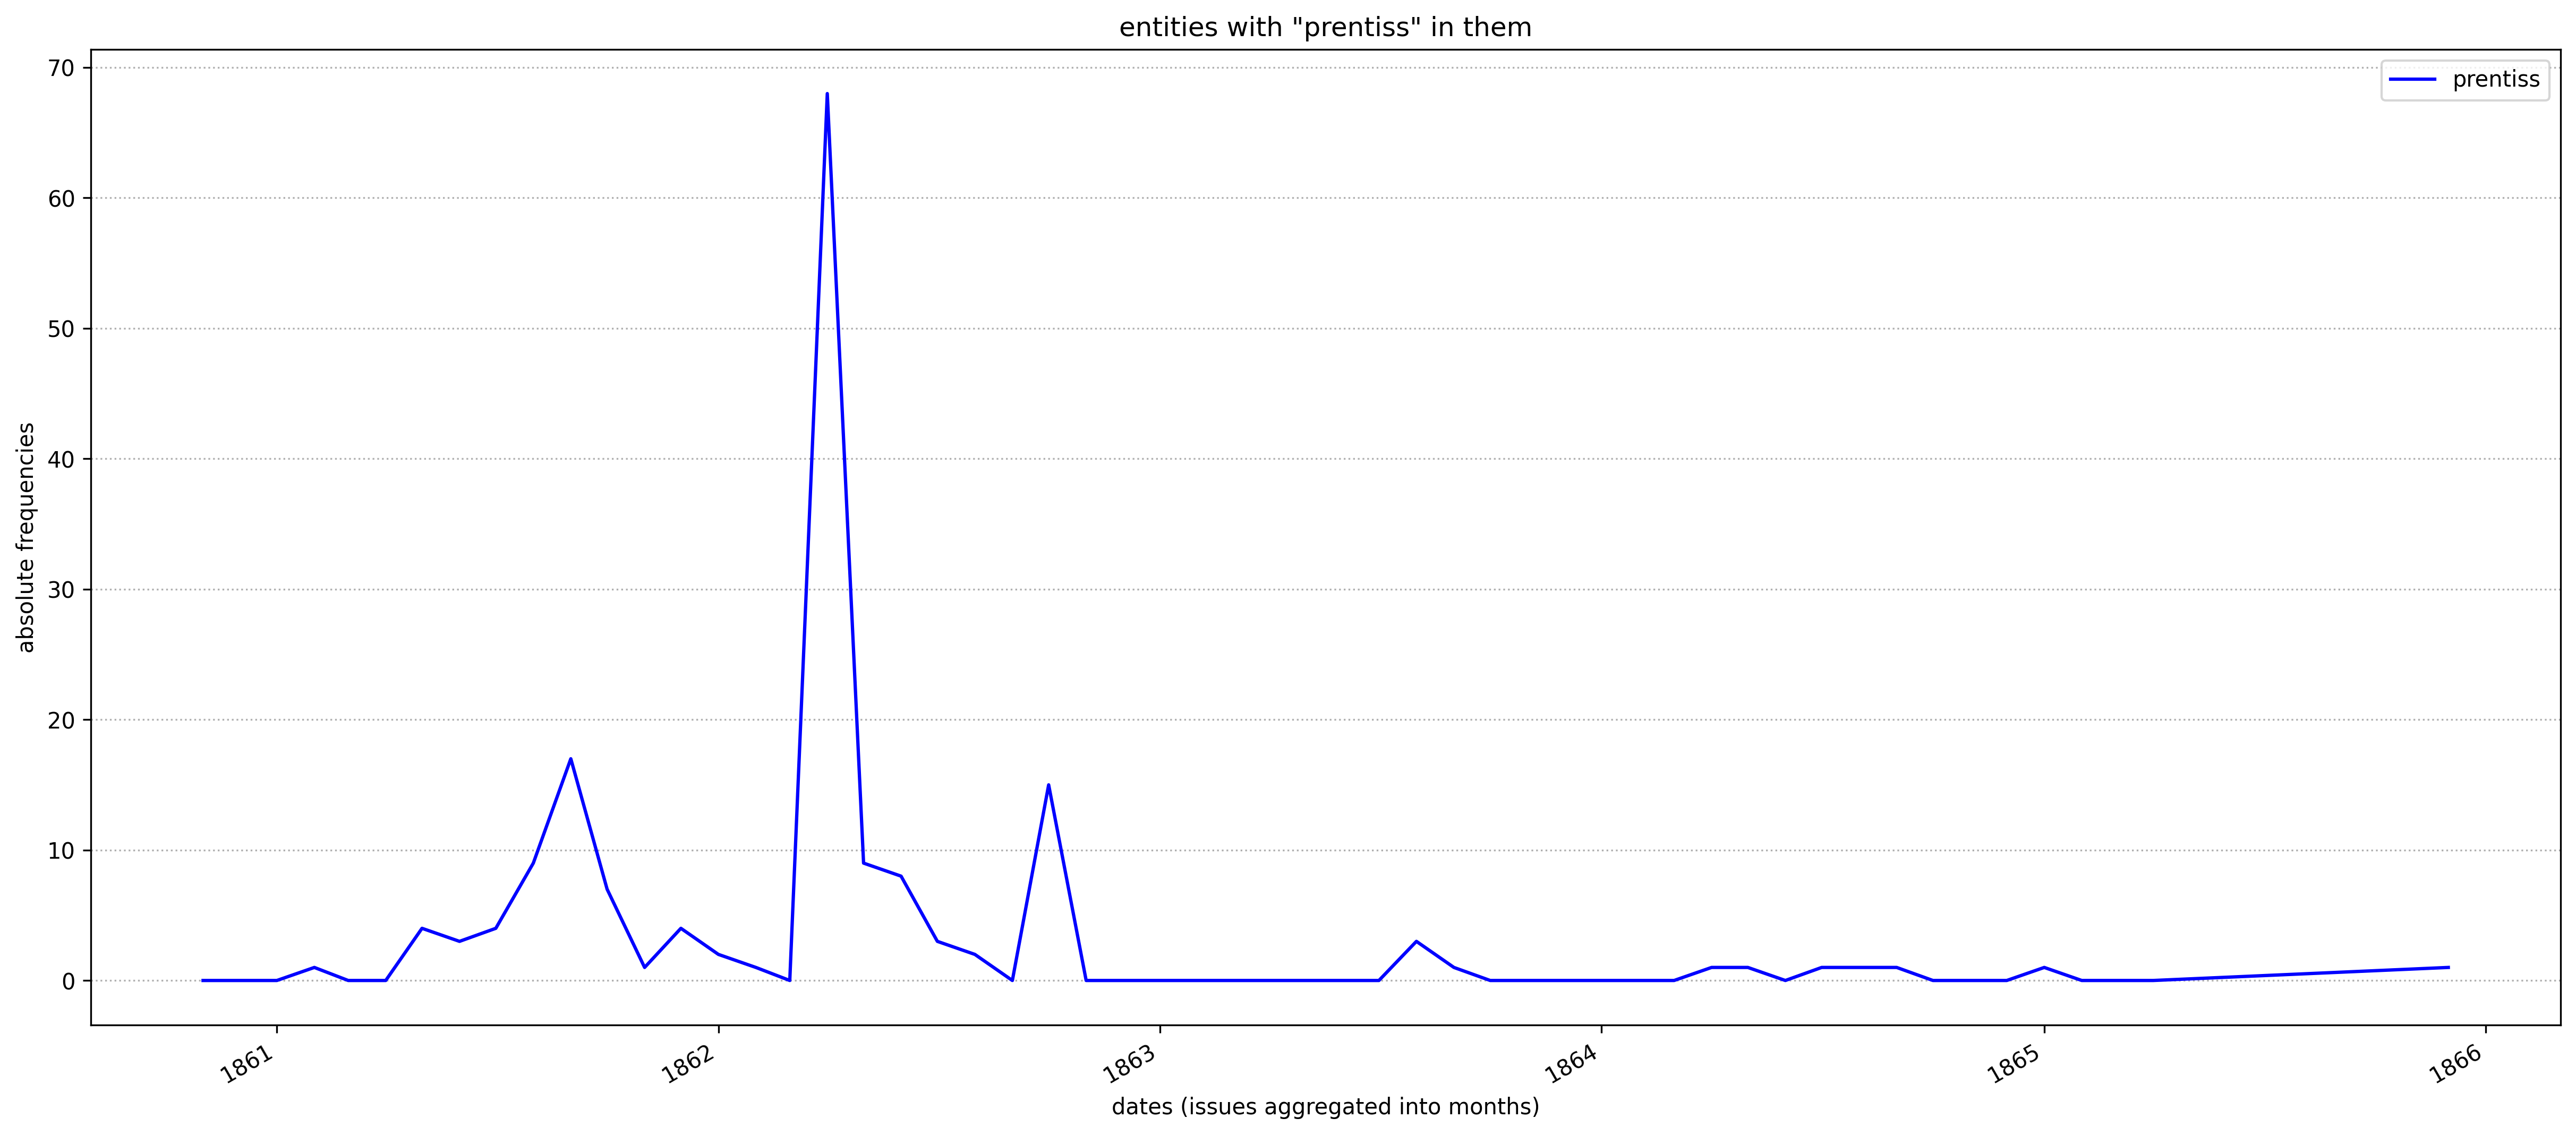
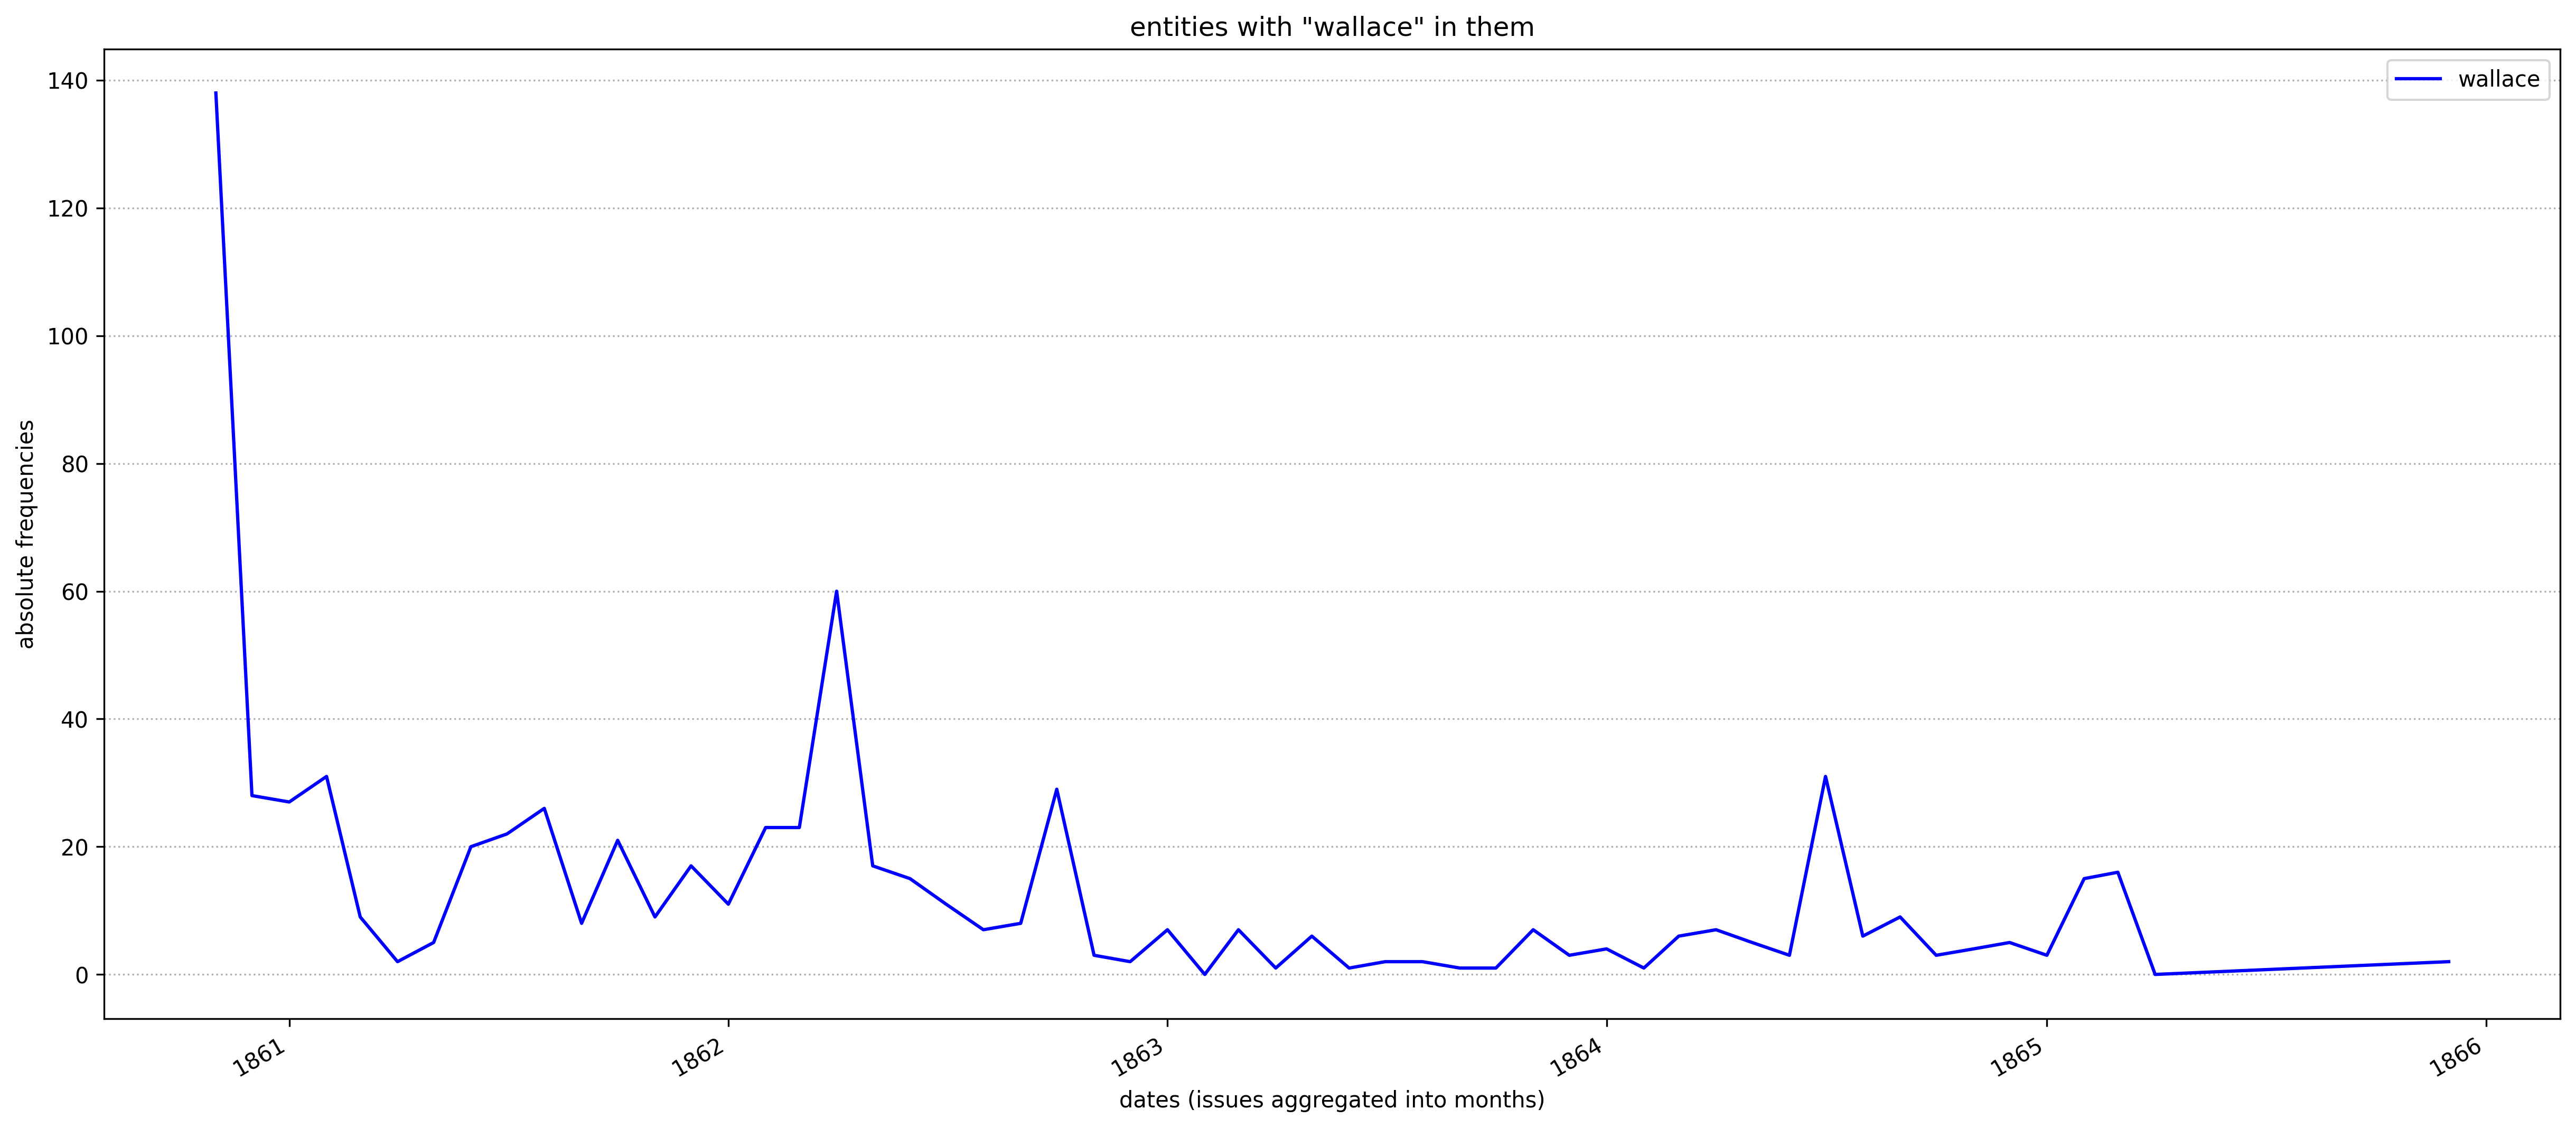
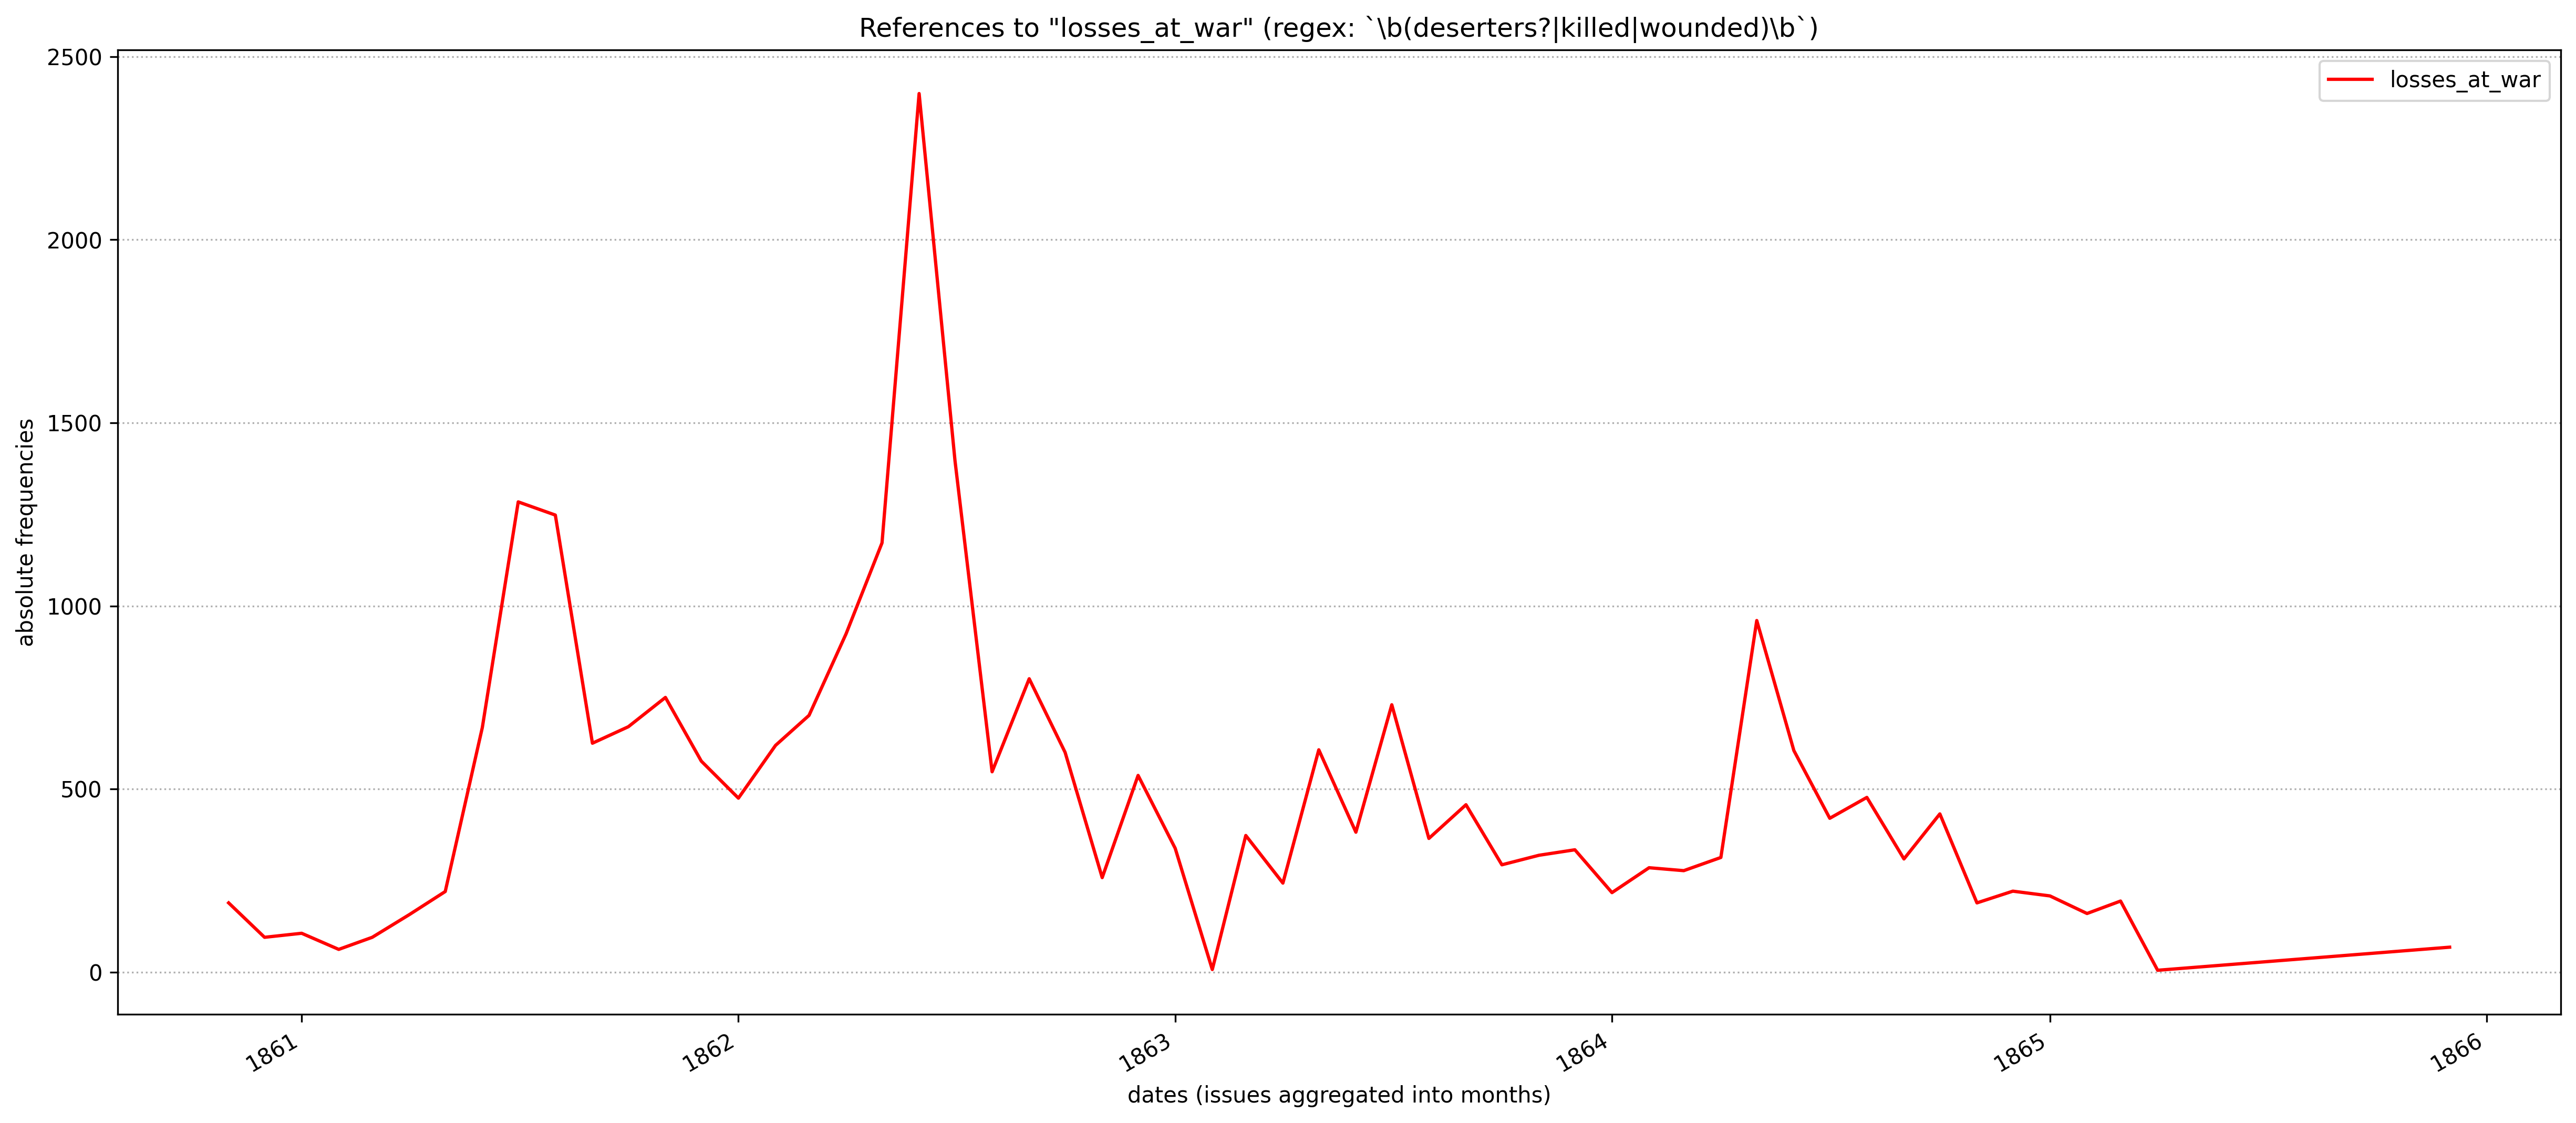
The battle of Shiloh is considered one of the bloodiest engagements of the Civil War. If we look at the mentions of deserter(s), killed, and wounded, we discover the most significant spike of all these terms soon after the battle.
10.2 Code: Line Graph
import re
import pandas
import matplotlib.pyplot as plt

template = """> Plotting data: %s"""

# load entities data
df = pandas.read_csv("entities.csv", sep="\t", header=0)
print(df)

def searchDispatchData(searchTerm, fileName="fromTagged"):
    print(template % (searchTerm))

    # processing our data
    df["month"] = [re.sub("-\d\d$", "-01", str(i)) for i in df["date"]]
    df["month"] = pandas.to_datetime(df["month"], format="%Y-%m-%d")

    # create zeros : two columns "month" and "searchTerm" (where all values are zeros)
    dfZeros = df[["month"]]
    dfZeros = dfZeros.reset_index()
    dfZeros[searchTerm] = 0
    dfZeros = dfZeros.drop_duplicates()

    # create a new table only with values that we want
    dfTemp = df[df.itemUnified.str.contains(searchTerm, na=False)]
    dfTemp = dfTemp[["month", "itemType"]]
    dfTemp = dfTemp.groupby(["month"]).count()
    dfTemp = dfTemp.reset_index()
    dfTemp[searchTerm] = dfTemp["itemType"]
    dfTemp = dfTemp[["month", searchTerm]]

    # merge with dfZeros (reason: we need explicit 0 values for dates when our search term is not found
    # otherwise the graph will be misleading as the line on the graph will be connecting only dates with
    # frequencies more than zero)
    dfTemp = dfTemp.append(dfZeros, ignore_index=True)
    dfTemp = dfTemp.groupby(["month"]).sum()
    dfTemp = dfTemp.sort_values(by="month")
    dfTemp = dfTemp.reset_index()

    # plotting the results
    plt.rcParams["figure.figsize"] = (20, 9)
    dfTemp.plot(x='month', y=searchTerm, legend=True, color='blue')

    plt.ylabel("absolute frequencies")
    plt.xlabel("dates (issues aggregated into months)")
    plt.title("entities with \"%s\" in them" % (searchTerm))
    plt.gca().yaxis.grid(linestyle=':')

    # the following line will simply open a pop-up with the graph
    # plt.show()

    # the following line will save the graph into a file
    fileNameToSave = "plot1_%s_%s.png" % (fileName, searchTerm)
    plt.savefig(fileNameToSave, dpi=300, bbox_inches="tight")
    plt.close("all")

searchDispatchData("shiloh", "shiloh")
10.3 Missing Zeros Problem
Compare the following two graphs. The first one is “with zeros” and the second one “without zeros”.
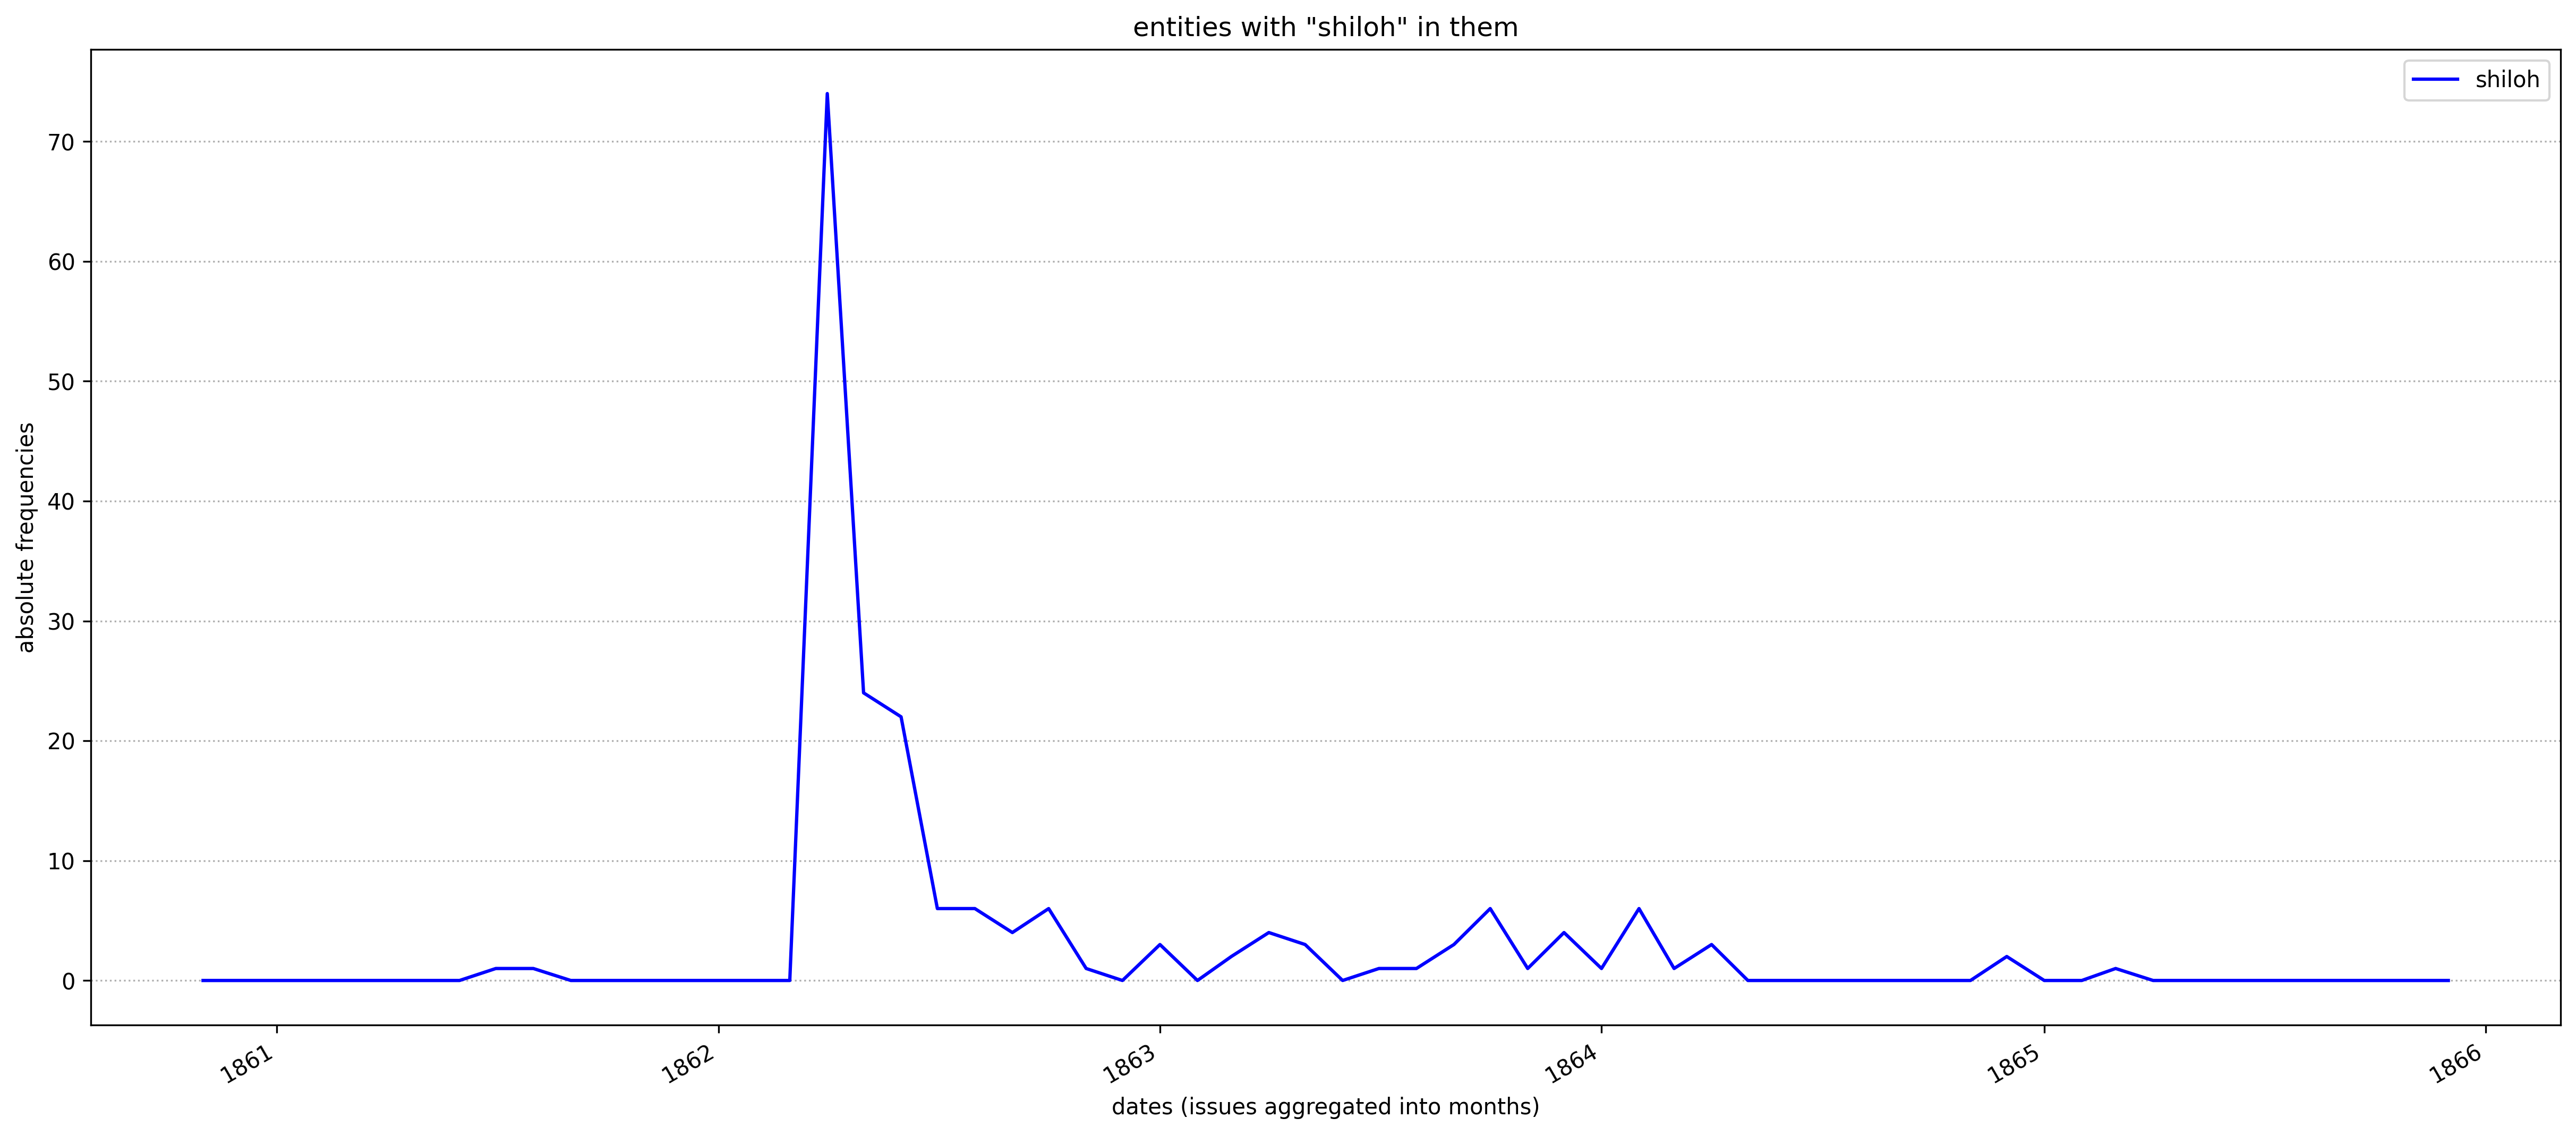
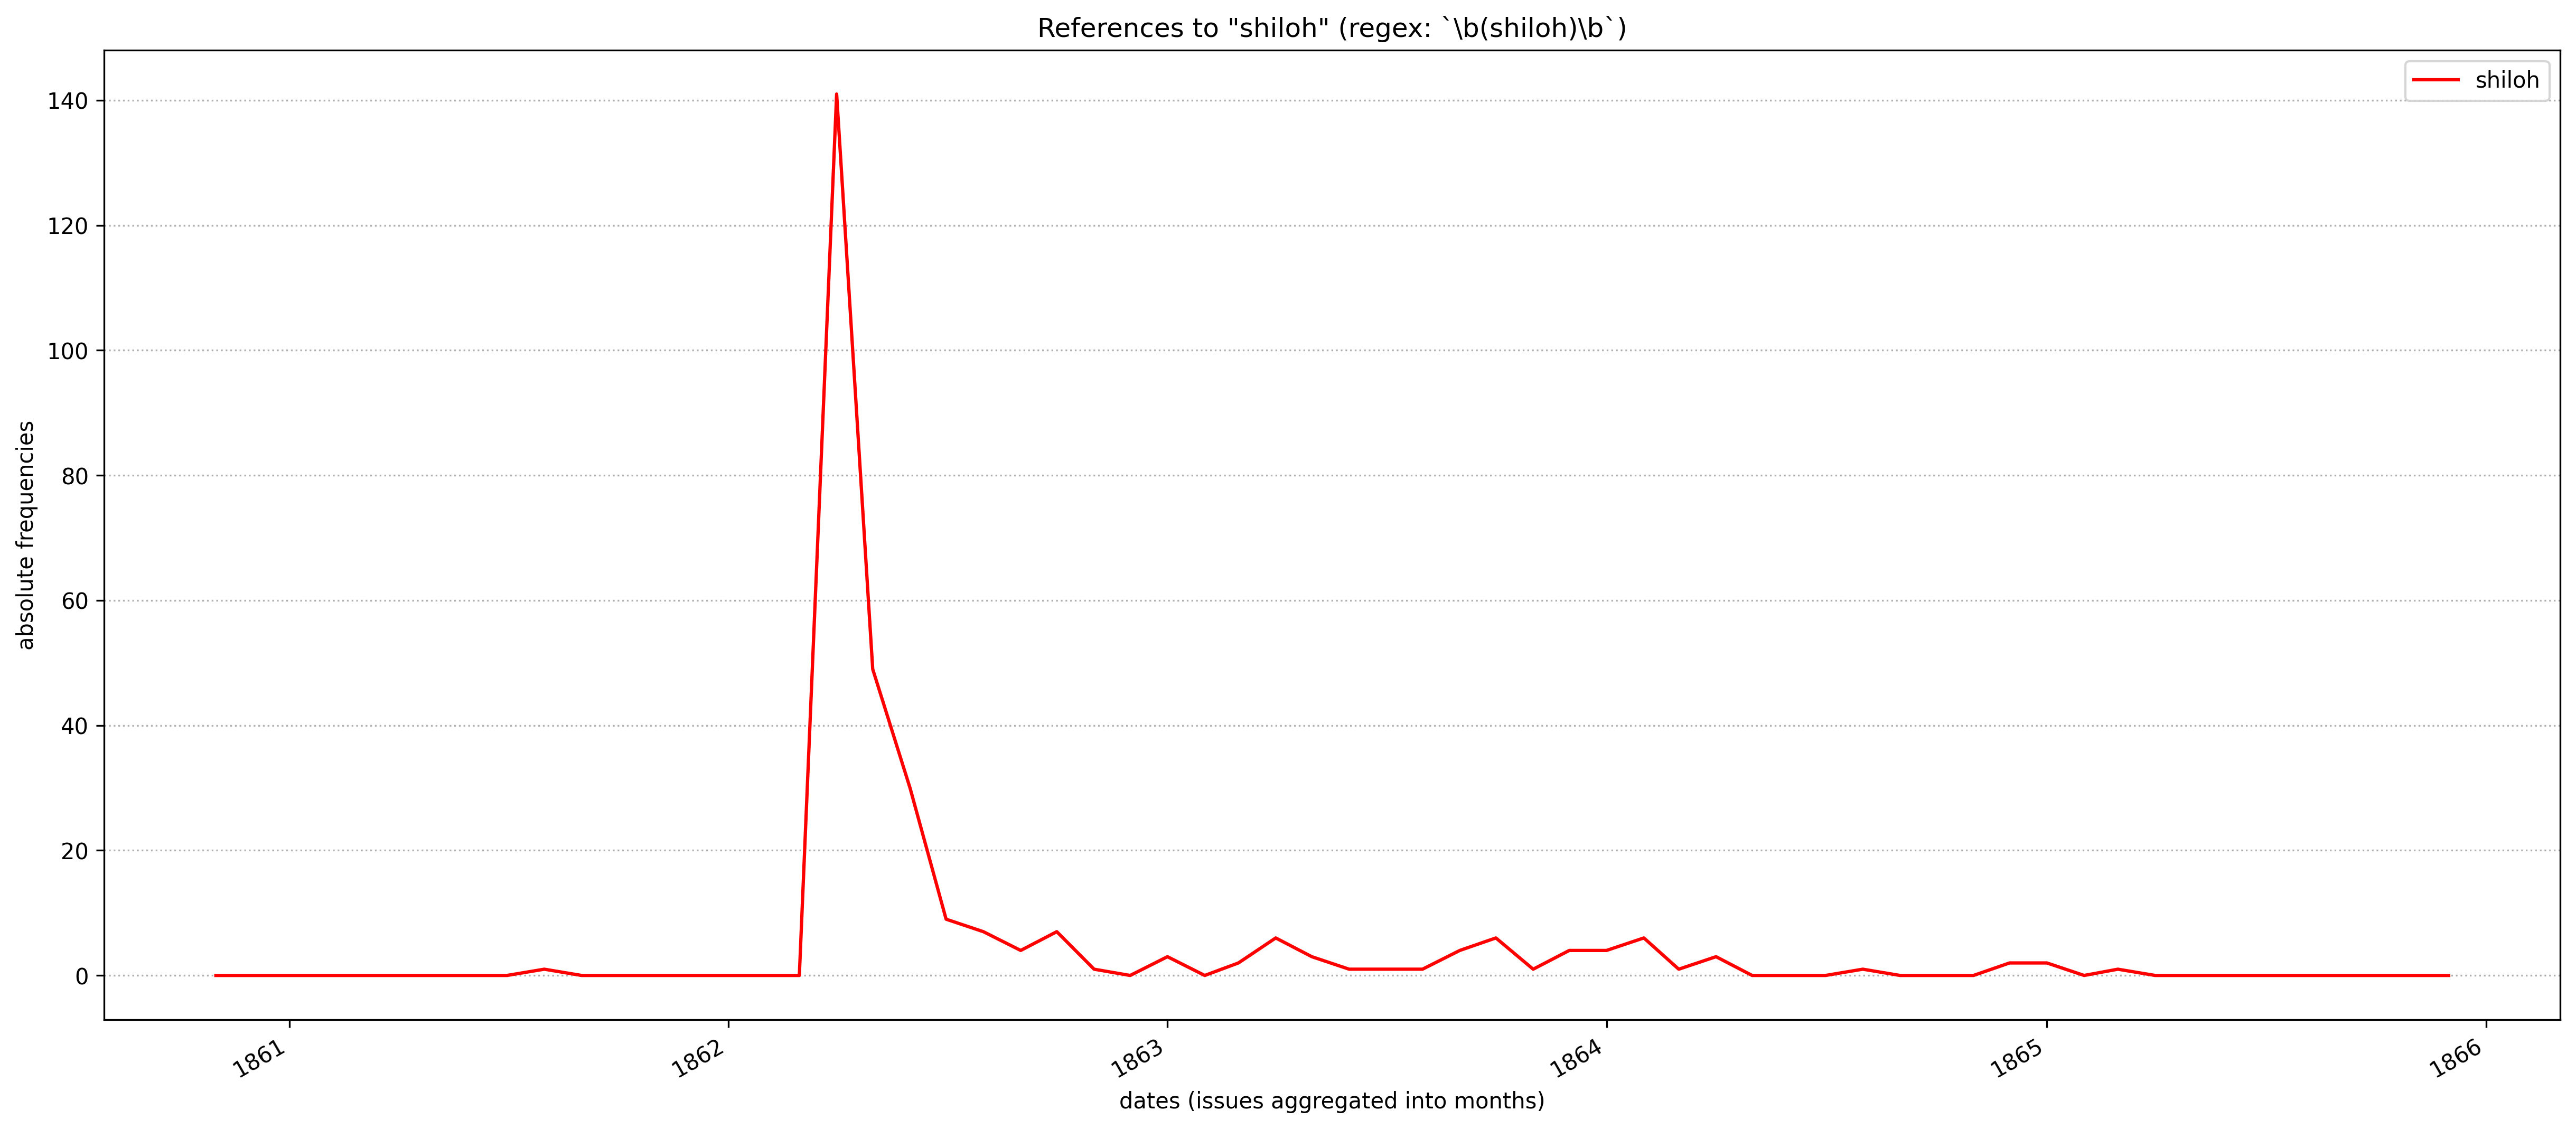
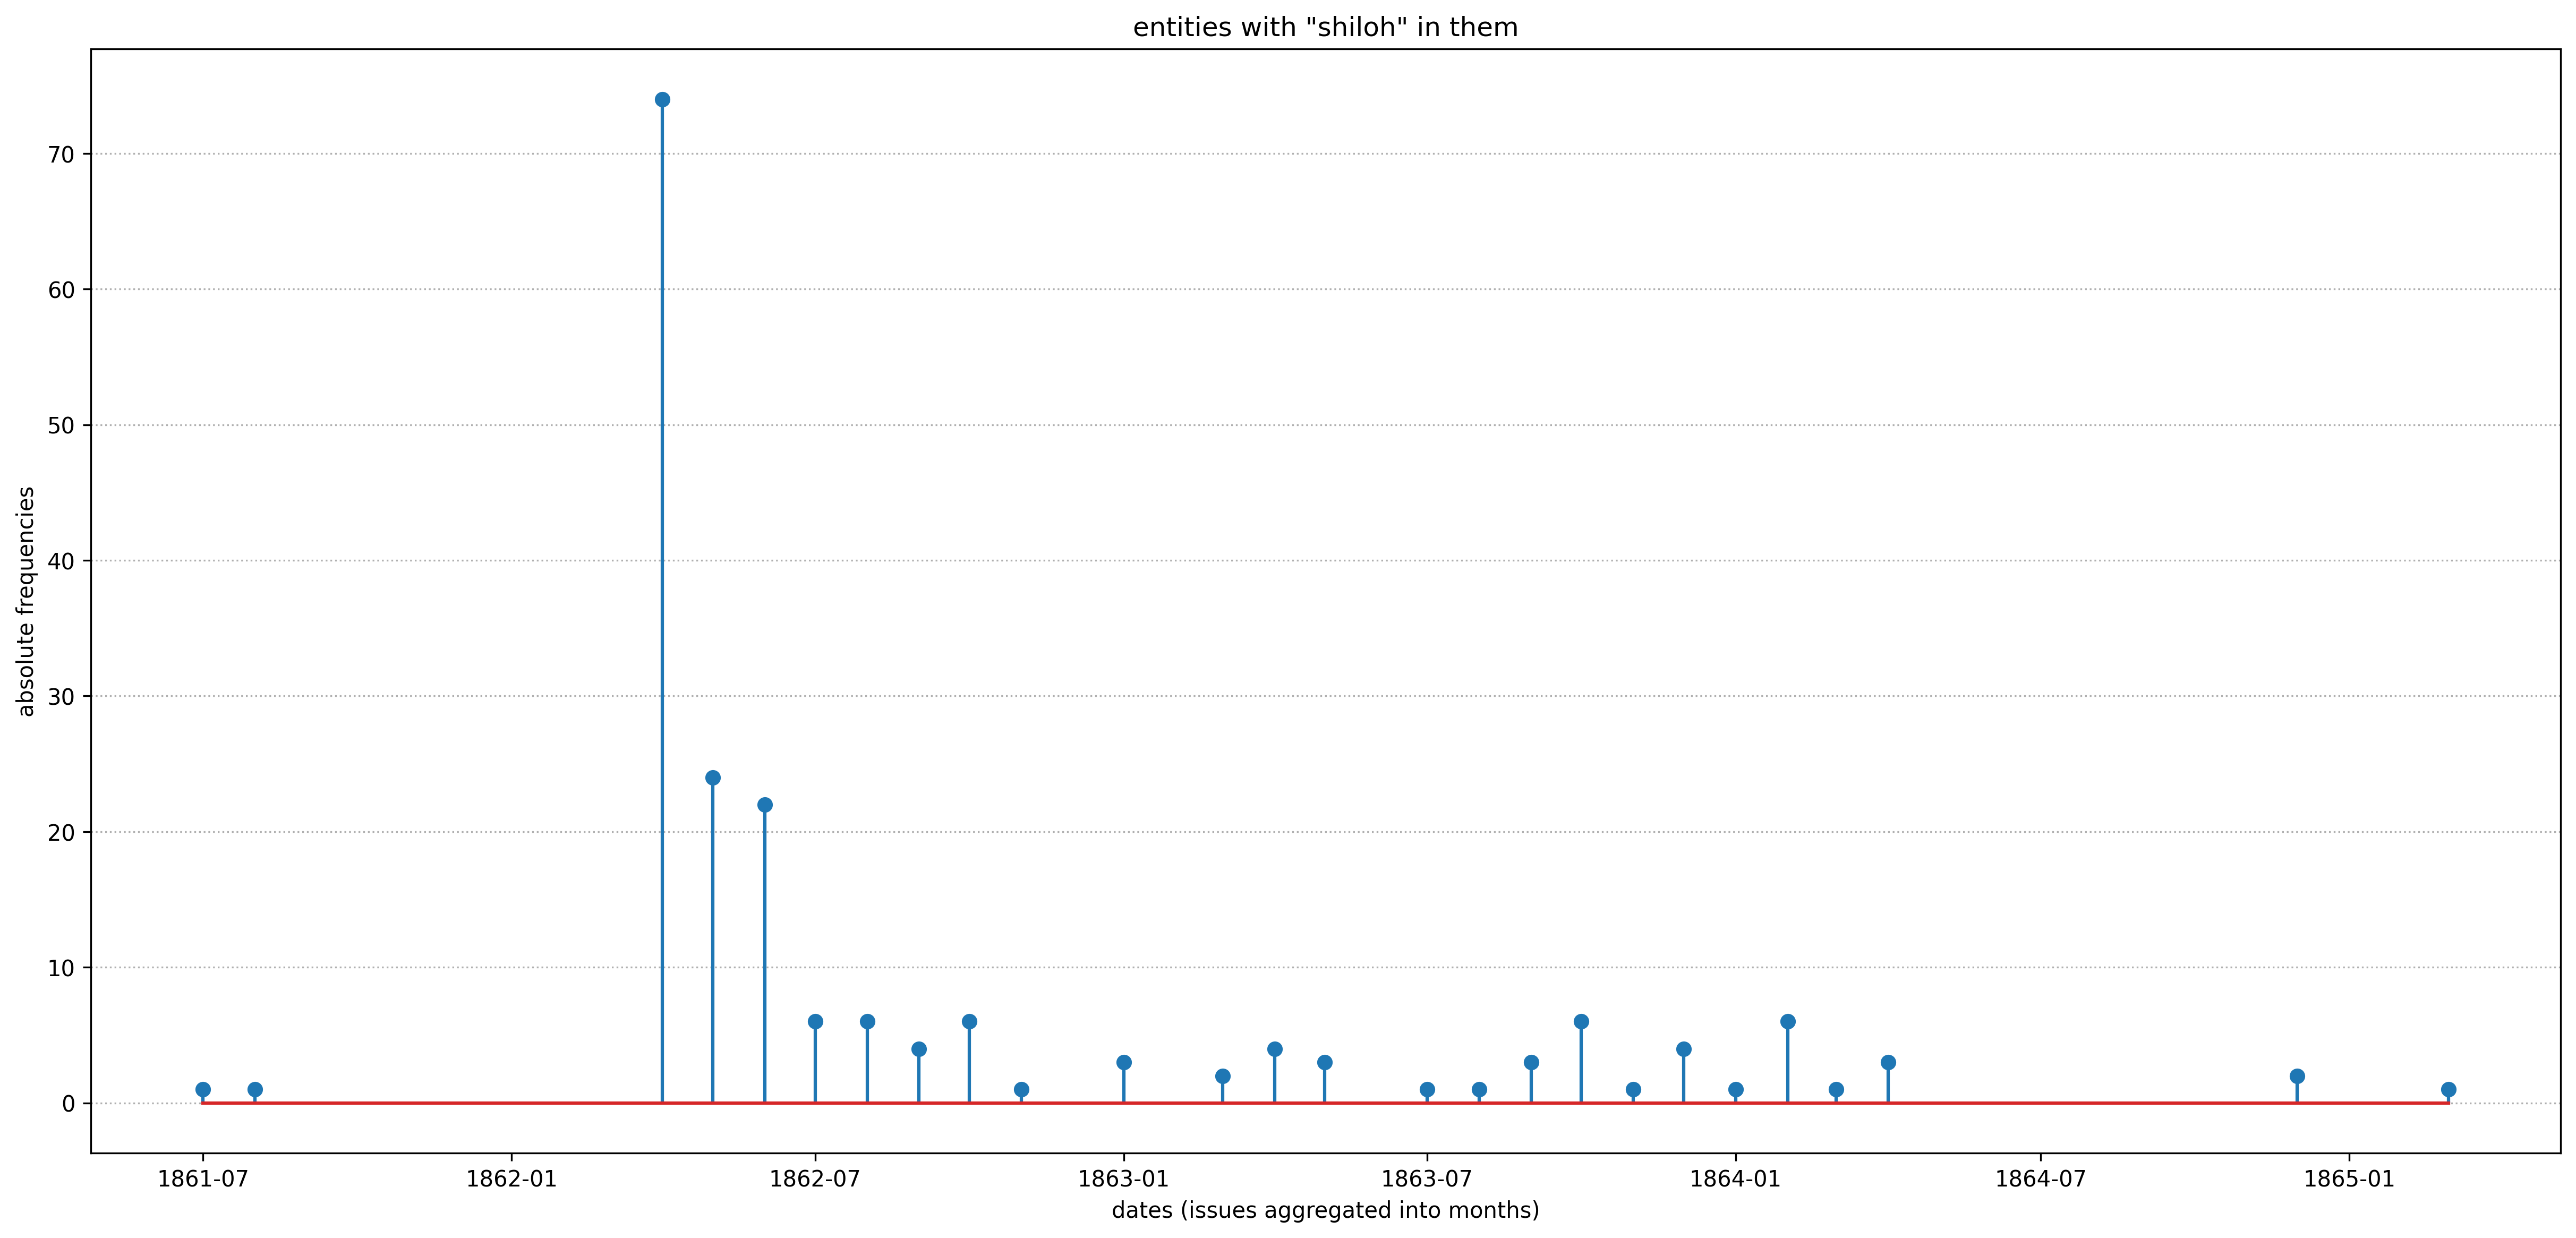
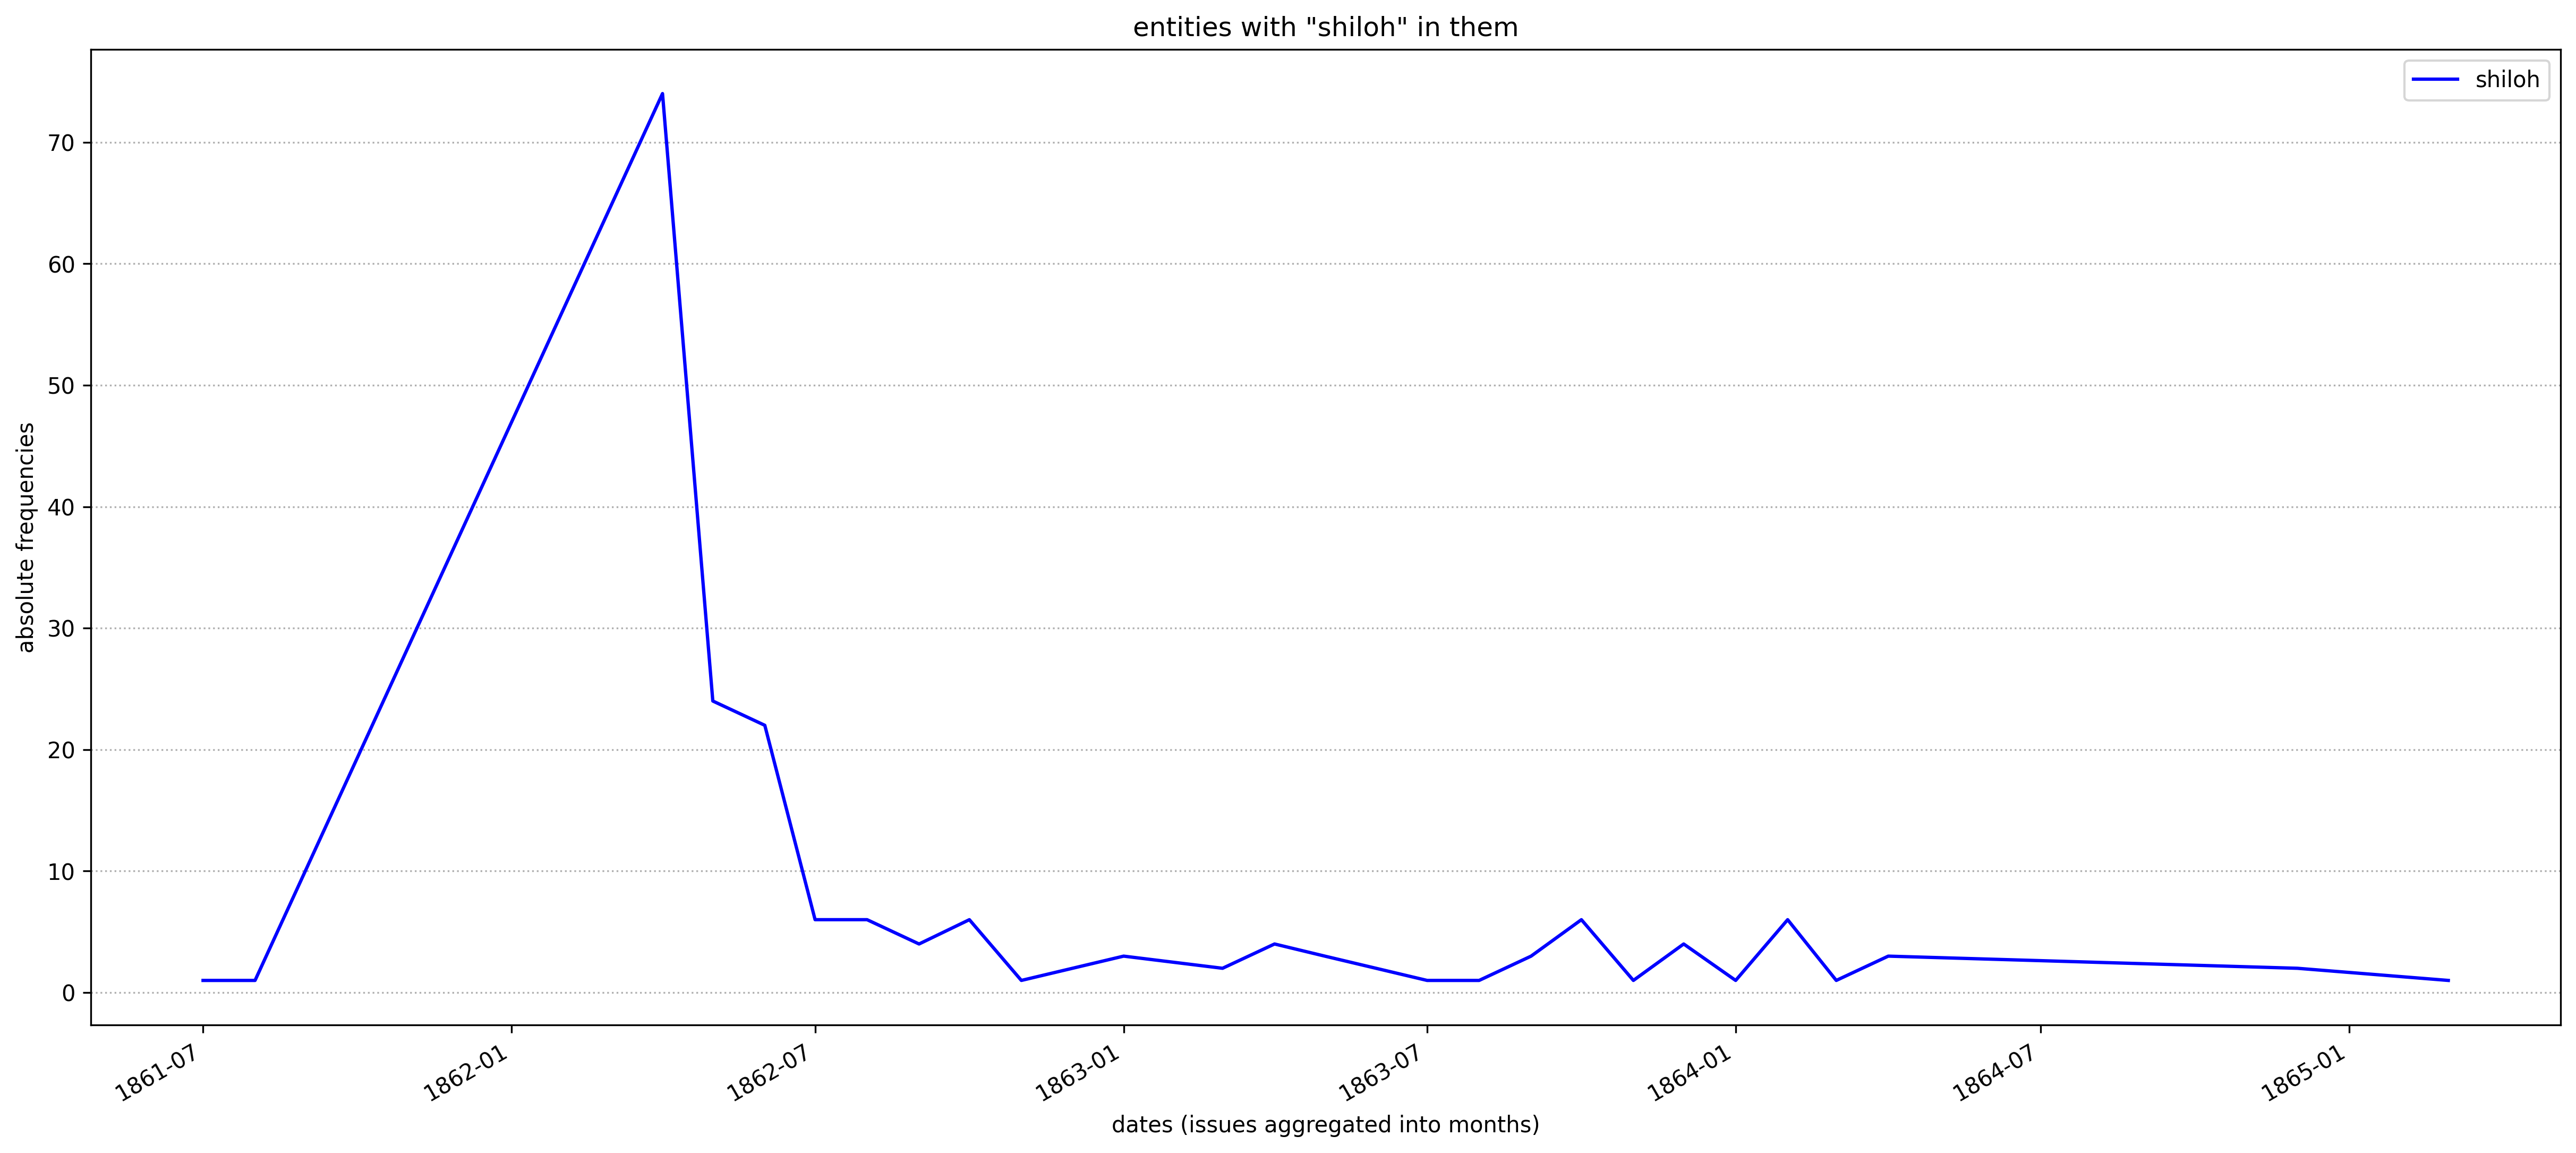 In the second graph we simply “collected” all mentions of Shiloh and plotted them with a line graph. The problem is that we have no explicit data on dates when Shiloh is not mentioned and, as a result, the graph suggests that Shiloh is mentioned quite a lot in the course of the year 1861. If we look at the first graph—where we have data for all the dates and each date when Shiloh is not mentioned has a value 0—we can see that Shiloh is mentioned only a couple of times in 1861 and then there is a huge spike of mentions in 1862, when the Battle of Shiloh took place.
The main takeaway from this is that you should always be mindful of how you are filtering your data and what strategies you use for plotting it. Line graph can make a false suggestion, when some x-values are missing. A more reliable graph in such cases would be a “lollipop” graph that is shown below — lollipop graphs do not connect observations, and due to that they clearly show gaps in data.
10.4 Code: Lollipop Graph
import re
import pandas
import matplotlib.pyplot as plt

template = """> Plotting data: %s"""

# load entities data
df = pandas.read_csv("entities.csv", sep="\t", header=0)
print(df)

def searchDispatchData(searchTerm, fileName="fromTagged"):
    print(template % (searchTerm))

    # processing our data
    df["month"] = [re.sub("-\d\d$", "-01", str(i)) for i in df["date"]]
    df["month"] = pandas.to_datetime(df["month"], format="%Y-%m-%d")

    # create a new table only with values that we want
    dfTemp = df[df.itemUnified.str.contains(searchTerm, na=False)]
    dfTemp = dfTemp[["month", "itemType"]]
    dfTemp = dfTemp.groupby(["month"]).count()
    dfTemp = dfTemp.reset_index()
    dfTemp[searchTerm] = dfTemp["itemType"]
    dfTemp = dfTemp[["month", searchTerm]]

    # plotting the results - lollipop
    plt.rcParams["figure.figsize"] = (20, 9)
    plt.stem(dfTemp['month'], dfTemp[searchTerm])

    plt.ylabel("absolute frequencies")
    plt.xlabel("dates (issues aggregated into months)")
    plt.title("entities with \"%s\" in them" % (searchTerm))
    plt.gca().yaxis.grid(linestyle=':')

    # the following line will save the graph into a file
    fileNameToSave = "plot1_lollipop_%s_%s.png" % (fileName, searchTerm)
    plt.savefig(fileNameToSave, dpi=300, bbox_inches="tight")
    plt.close("all")

searchDispatchData("shiloh", "shiloh")
10.5 Jupyter Notebook
Jupyter Notebook (https://jupyter.org/) is a web application for creating and sharing computational documents. It is a very popular way of writing analytical code in Python. It allows one to write and execute code right in your browser, to combine code with regular prose, ans, also, execute written code section by section (or, more correctly, cell by cell — using the Jupyter lingo) — which in some cases has a lot of advantages.
Jupyter Notebook can be installed in the manner that you are already familiar with:
python -m pip install notebook (or: python3 -m pip install notebook)
It can be then opened by running the following command in the command line tool of your choice (you should be in your working directory; make sure to restart your command line tool after installation):
jupyter notebook
After the Jupyter Notebook starts, you will be taken to your default browser and the first page of the Jupyter interface should show you the contents of the folder from which you started it. Something like this:
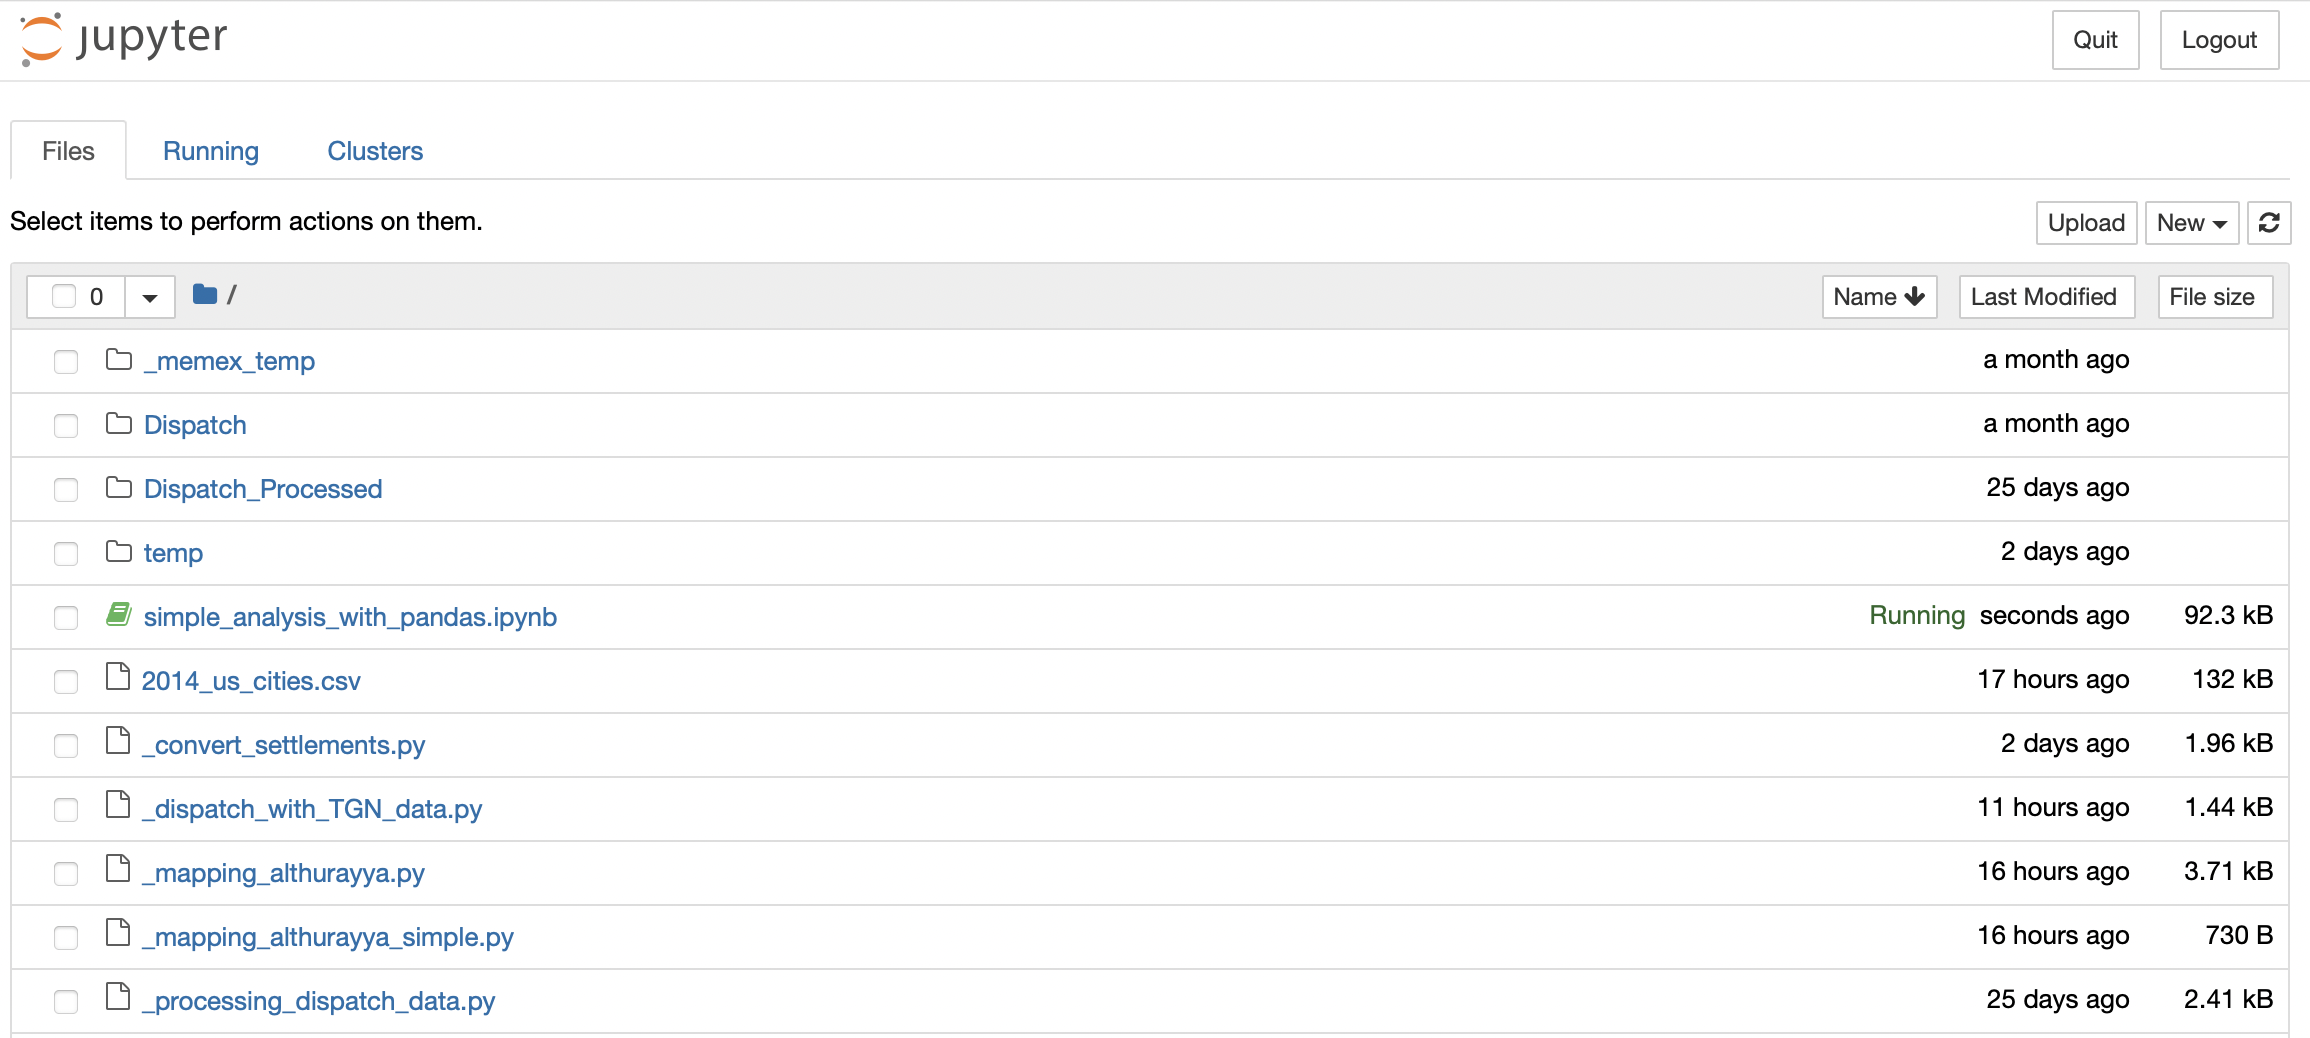
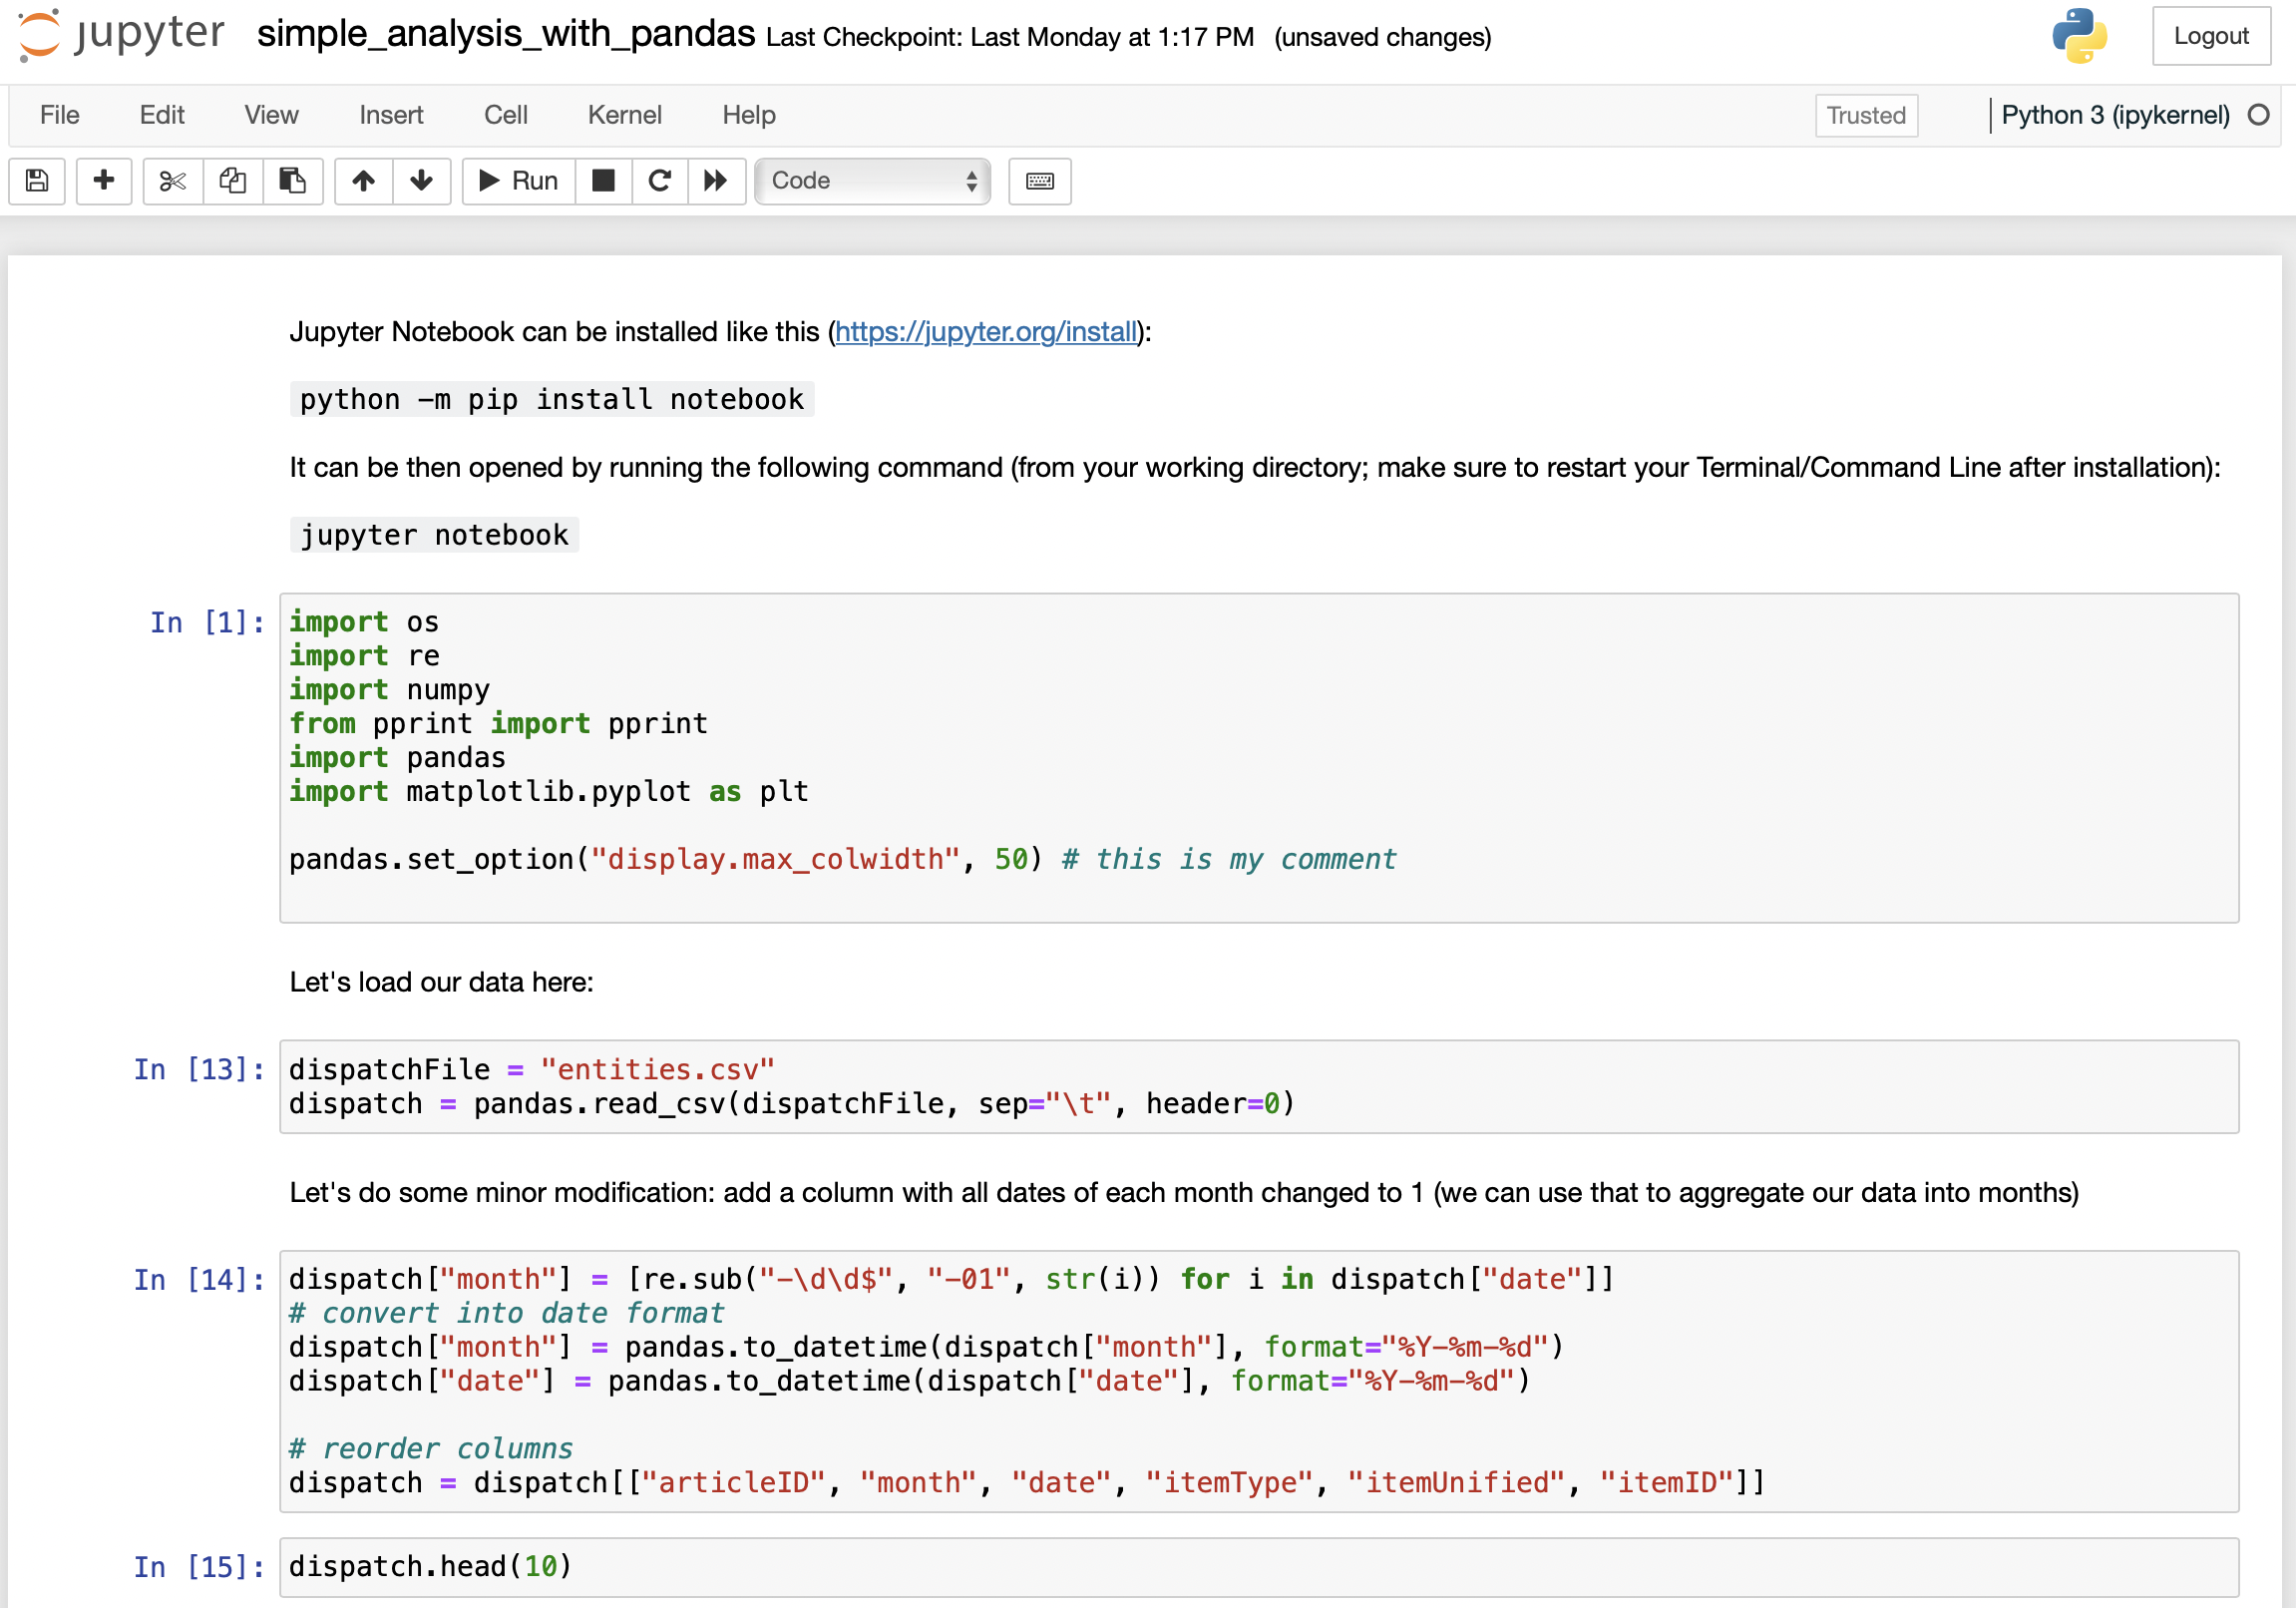
You can download this already prepared notebook, which should look like this when you open it:
10.6 Homework
- Rewrite the code in such a way that would allow you to graph any kind of words or phrases in a similar manner (“The Losses at War” graph is generated in this manner).;
- Annotate your script (i.e., add comment to every line of code describing what is happening there);
Submitting homework:
- Homework assignment must be submitted by the beginning of the next class;
- Now, that you know how to use GitHub, you will be submitting your homework pushing it to github:
- Create a relevant subfolder in your repository and place your HW files there; push them to your GitHub account;
- Email me the link to your repository with a short message (Something like: I have completed homework for Lesson 3, which is uploaded to my repository … in subfolder
L03)
- Email me the link to your repository with a short message (Something like: I have completed homework for Lesson 3, which is uploaded to my repository … in subfolder
- Create a relevant subfolder in your repository and place your HW files there; push them to your GitHub account;
10.7 Solution
Below is the solution to the homework.
import re
import os
import io
import pandas
import matplotlib.pyplot as plt

source = "./Dispatch/"
lof = os.listdir(source)

template = """
=================================================================================
= Plotting: %s (searching for: `\\b(%s)\\b`)
=================================================================================
"""


def searchDispatch(searchTermREGEX, searchTermPretty):
    print(template % (searchTermREGEX, searchTermPretty))

    counter = 0
    entities = []  # we will collect all extracted data here
    for f in lof:
        counter += 1
        if counter % 100 == 0:
            print(counter)

        if f.startswith("dltext"):  # fileName test
            newF = f.split(":")[-1] + ".yml"  # in fact, yml-like

            issueVar = []
            c = 0  # technical counter
            with open(source + f, "r", encoding="utf8") as f1:
                text = f1.read()
                date = re.search(r'<date value="([\d-]+)"', text).group(1)
                split = re.split("<div3 ", text)

                for s in split[1:]:
                    c += 1
                    s = "<div3 " + s  # a step to restore the integrity of items

                    try:
                        unitType = re.search(r'type="([^\"]+)"', s).group(1)
                    except:
                        unitType = "noType"

                    try:
                        header = re.search(r'<head.*</head>', s).group(0)
                        header = re.sub("<[^<]+>", "", header)

                    except:
                        header = "NO HEADER"

                    text = s
                    text = re.sub("<[^<]+>", " ", text)
                    text = re.sub(" +\n|\n +", "\n", text)
                    text = text.strip()
                    text = re.sub("\n+", ";;; ", text)
                    text = re.sub(" +", " ", text)
                    text = re.sub(r" ([\.,:;!])", r"\1", text)

                    itemID = date + "_" + unitType + "_%03d" % c

                    if len(re.sub("\W+", "", text)) != 0:
                        itemIdvar = "ID: " + itemID
                        dateVar = "DATE: " + date
                        unitType = "TYPE: " + unitType
                        header = "HEADER: " + header
                        # @§@ is used to replace ":", because in YML : is used as a divider between the key and value
                        text = "TEXT: " + text.replace(":", "@§@") + "\n\n"
                        var = "\n".join(
                            [itemIdvar, dateVar, unitType, header, text])

                        issueVar.append(var)

                        # NOW, WE CAN ADD SOME CODE TO PROCESS EACH ITEM AND COLLECT ALL INTO OUR TIDY DATA FORMAT
                        # STRUCTURE: itemID, dateVar, EXTRACTED_ITEM (type, unified_form, id)
                        # ADDING TO: entities (list)

                        results = re.findall(r"\b(%s)\b" %
                                             searchTermREGEX, text.lower())
                        matches = str(len(results))
                        tempVar = "\t".join([itemID, date, matches])
                        entities.append(tempVar)

    header = "\t".join(["itemID", "date", searchTermPretty])
    entitiesFinal = header + "\n" + "\n".join(entities)
    with open("search_results_%s.csv" % searchTermPretty, "w", encoding="utf8") as f9:
        f9.write(entitiesFinal)

    # reading our string of data into a pandas dataframe
    entitiesFinalStringIO = io.StringIO(entitiesFinal)
    df = pandas.read_csv(entitiesFinalStringIO, sep="\t", header=0)

    df["month"] = [re.sub("-\d\d$", "-01", str(i)) for i in df["date"]]
    df["month"] = pandas.to_datetime(df["month"], format="%Y-%m-%d")

    df = df[["month", searchTermPretty]]
    df = df.groupby(["month"]).sum()
    df = df.reset_index()

    # plot itself
    plt.rcParams["figure.figsize"] = (20, 9)
    df.plot(x='month', y=searchTermPretty, legend=True, color='red')

    plt.ylabel("absolute frequencies")
    plt.xlabel("dates (issues aggregated into months)")
    plt.title("References to \"%s\" (regex: `\\b(%s)\\b`)" %
              (searchTermPretty, searchTermREGEX))
    plt.gca().yaxis.grid(linestyle=':')

    # the following line will save the graph into a file
    plt.savefig("plot_%s.png" % searchTermPretty, dpi=300, bbox_inches="tight")
    plt.close("all")
    print("Done!")

searchDispatch("deserters?|killed|wounded", "losses_at_war")