13 Lesson 13: Social Network Analysis
13.1 Networks and SNA
- Any information can be aggregated into a network or represented as a network; we are constantly doing that when we conduct research and connect different bits of information around the subject of our studies (including people, places, events, and any other kind of physical objects). These connections can be represented as a network (hyperlinked information).
- This kind of networks help us establish connections among bits of evidence and various objects, and through that find new insights into objects of our studies. This kind of networks even though it can be presented as a growing digital object: we discussed this kind of network when we were looking into the Obsidian software (https://obsidian.md/) and how one can link different notes together. These notes can be visualized in order to discover new links and connections. However, this kind of network cannot be studied with the methods of social network analysis (SNA).
- SNA is a formalized method of analysis (rooted firmly in graph theory) of patterns of relationships in networks. The word social here is largely due to a significant popularity of this method in sociology and other social sciences, but it can be efficiently used to study patterns of relationships among any kind of objects (languages, texts, words, etc.).
- Unlike in the case of the first kind of network where any kind of object can be linked to any other kind of object through whatever kind of relationship, SNA requires formalized networks—an abstract model of some more complex reality, where the same kind of objects (unimodal network) are connected to each other through the same kind of relationship, which are represented with edges.
- For example, if we are studying some community of individuals who are connected to each other through different kinds of social ties, in order to apply SNA methods, we will will most likely need to create several different networks, each representing different type of relationships. For example, a network of family relationships is likely to be different from, say, professional relationships, or study circles. At the same time studying where and how these networks overlap will give us insights into how this community works. Modeling what constitutes “relationships” is largely in the hands of a researcher as different assumptions promise new insights.
- We can study inanimate objects in a similar manner. For example, relationships between books: where books will be nodes and edges between them will be determined by the amount of text one book “borrows” from another (see, https://kitab-project.org/); or by how similar their topics or authorial styles are, and so on.
- One of the “easiest” networks would be a route network and the SNA methods (or, here better, the graph theory) will be very helpful for improving our understanding of the space over which this network extends.
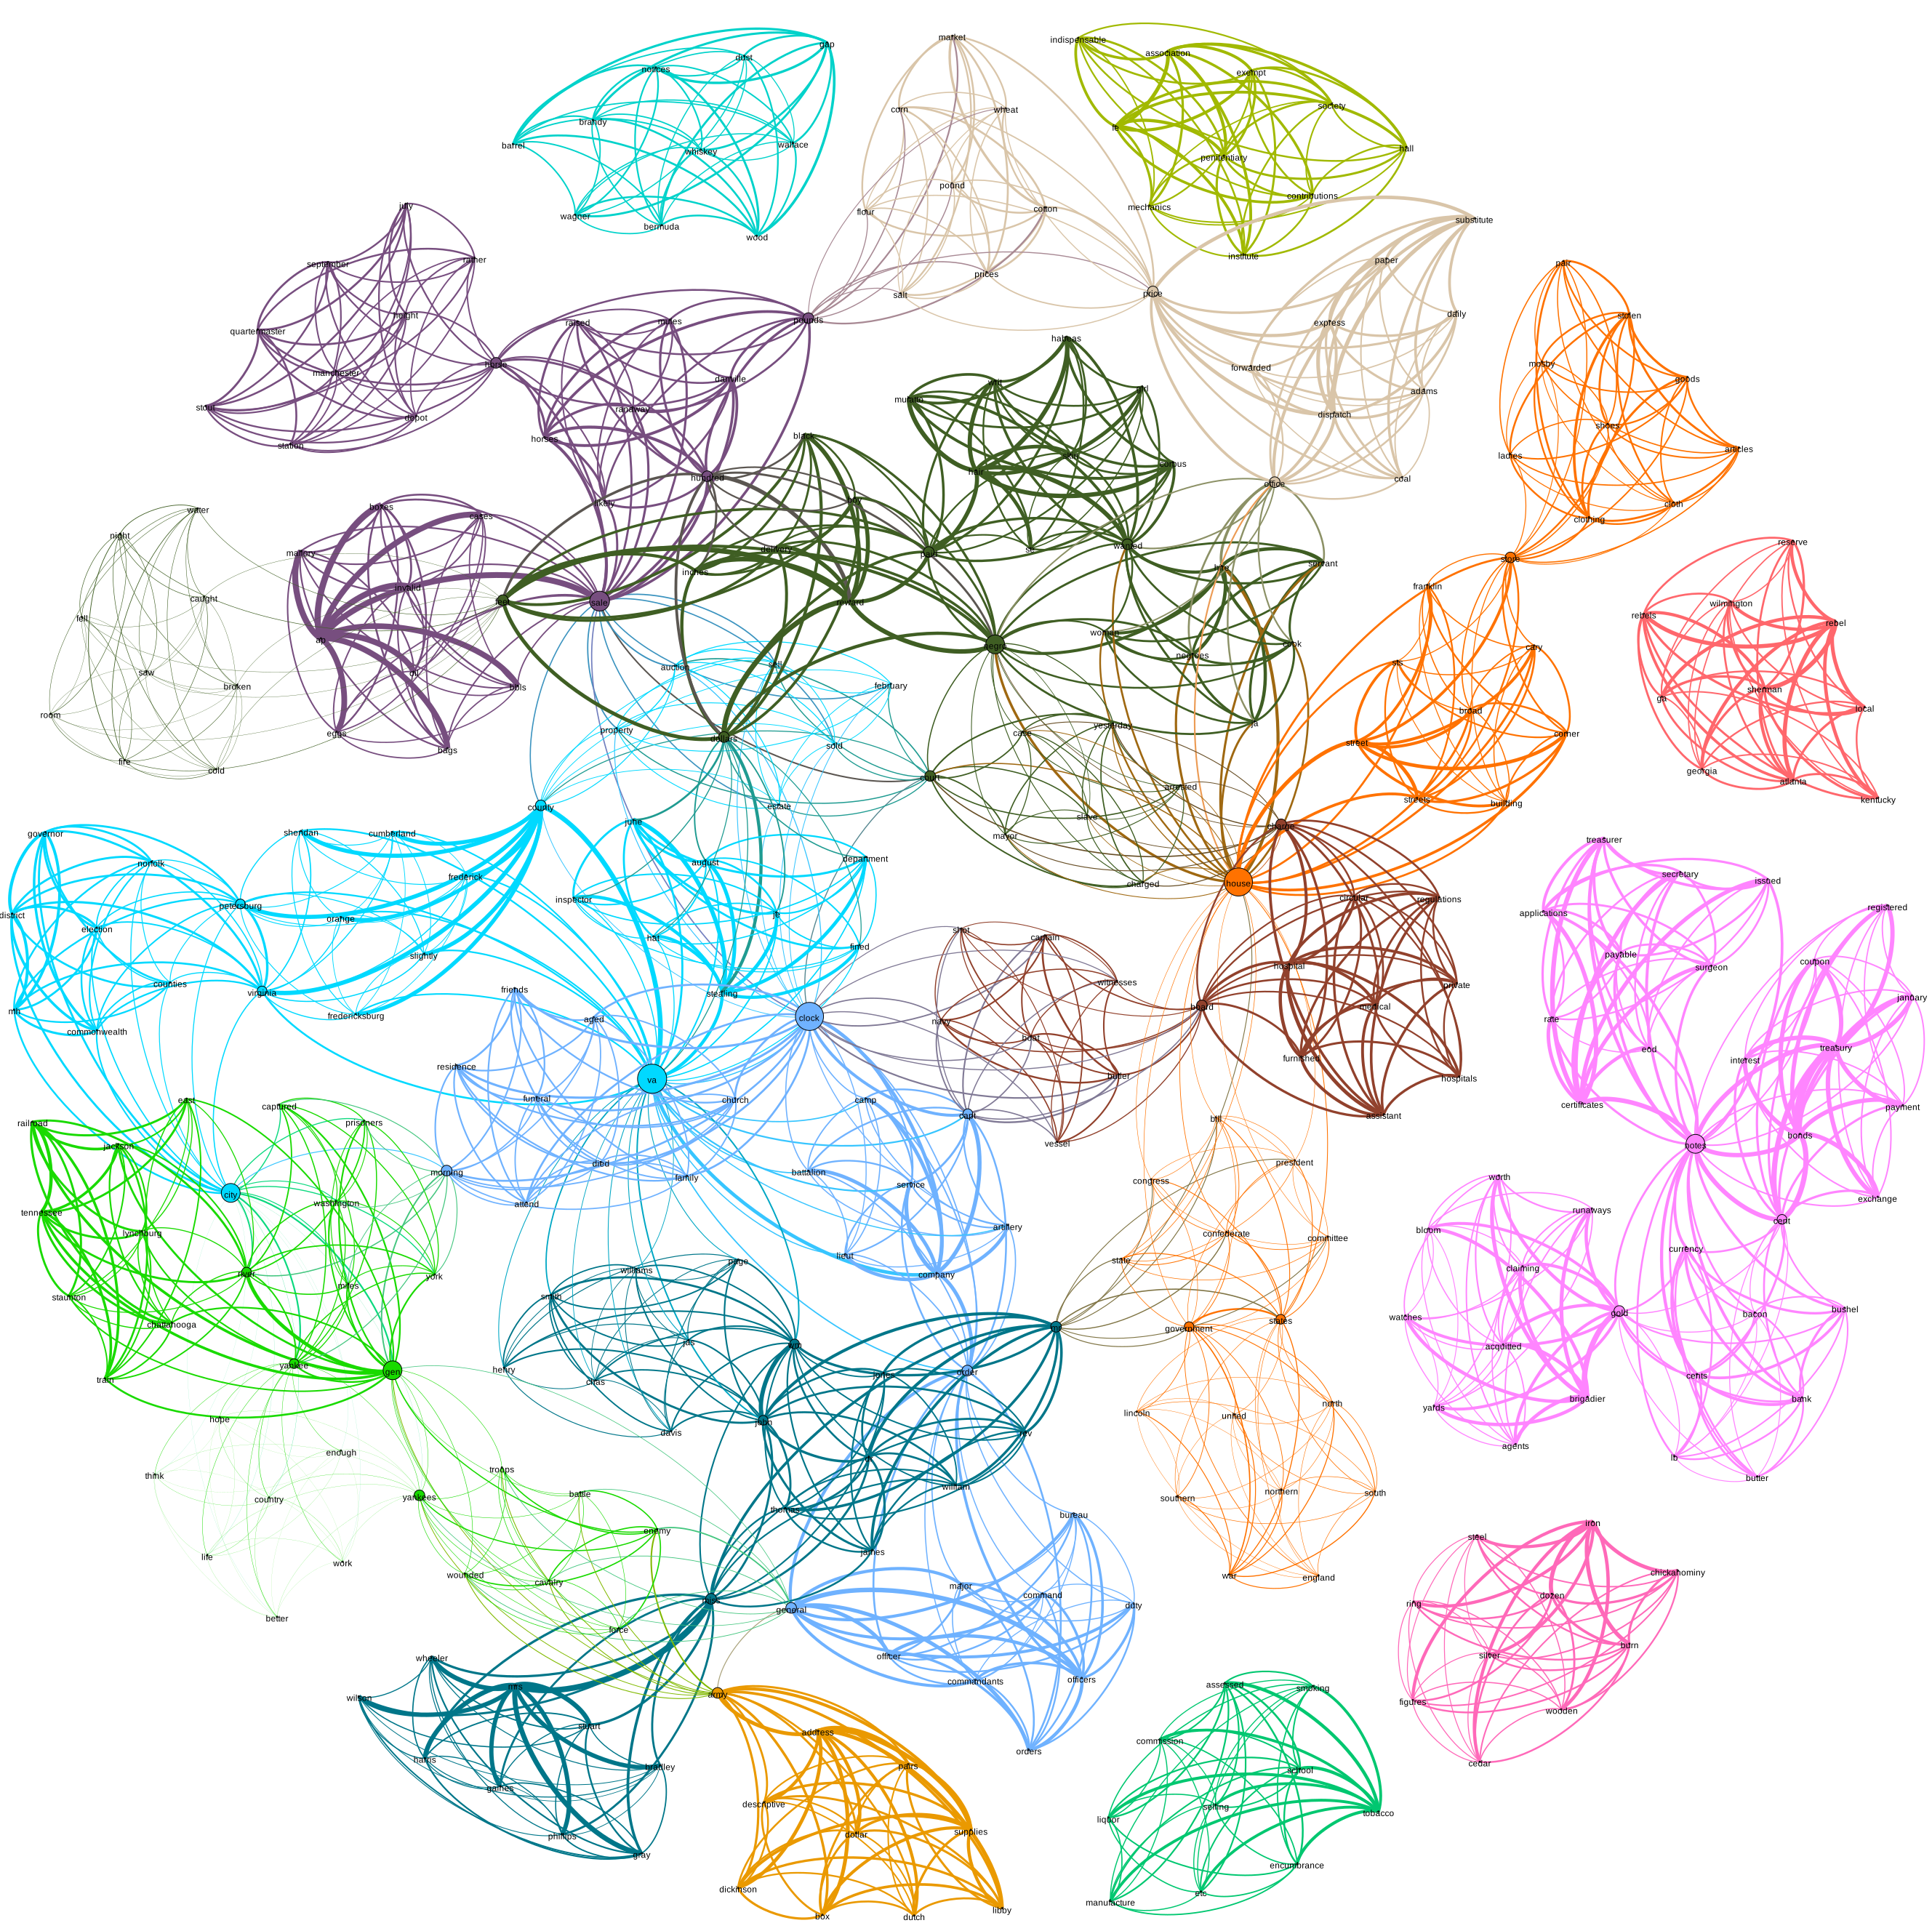
- Another example of a network will be individuals that appear in the Dispatch: we can create a network of people whose names appear in the same articles; the number of articles where they appear together will determine the weight of their connections. Such a network is very likely to reveal clusters of individuals whose lives were closely connected in real life. (Although the “real” type of connection here will be obscured by way we model the network).
13.2 SNA: Basic Concepts
- Networks / Graphs
- Patterns of relationships that connect individuals, institutions, or objects (or leave them unconnected)
- Examples: family ties—vertical and horizontal; patronage—who pays whom for what services; shared membership in organizations; patterns of contracts among companies.
- Main elements
- Node (vertex, point, item) — person, organization, country, document, etc.
- Edge (tie, link, line) — relationship, friendship, common attendance, cooccurance, kinship, membership, or any other construed category
- Directed and Undirected links: marriage—undirected; patronage—directed.
- Graphs (Sociograms): the object which is constructed from nodes and edges.
- Matrices (pl. of matrix): a way of representation of connections.
- Graph properties
- Density: number of edges / number of edges in a complete graph (example of complete and incomplete graph)
- Centrality measures:
- Degree: Proportional to the number of other nodes to which a node is linked – Number of links divided by (n-1). For example: it may measure exposure to what is flowing through the network (opportunity to influence directly; in-degree and out-degree).
- Closeness – the sum of shortest paths to all other points in the graph. Divide by (n-1), then invert. For example: it may measure how quickly information can travel.
- Betweenness – the extent to which a particular point lies ‘between’ other points in the graph; how many shortest paths (geodesics) is it on? A measure of brokerage or gate-keeping (How often a node lies on the shortest path between two other nodes)
- Eigenvector – a weighted measure of centrality that takes into account the centrality of other nodes to which a node is connected. That is, being connected with other central nodes increases centrality. E.g., secretary of powerful person. Google’s page rank algorithm is based on a variation of this approach.
- Communities - clusters of nodes that are more closely connected with each other than with other nodes in the network. There are many different algorithms that calculate communities.
13.3 Software: Gephi and Python
- Software: Gephi, https://gephi.org/
- Python implementation:
- SNA Package: https://networkx.org/
- Network analysis with NetworkX by Melanie Walsh
- Make an Interactive Network Visualization with Bokeh by Melanie Walsh
13.4 Data
- Star Wars:
- the networks here are rather simple: nodes are characters, edges are determined by whether characters share a scene; weight is based on how many scenes the characters share.
- Topic Models of the Dispatch
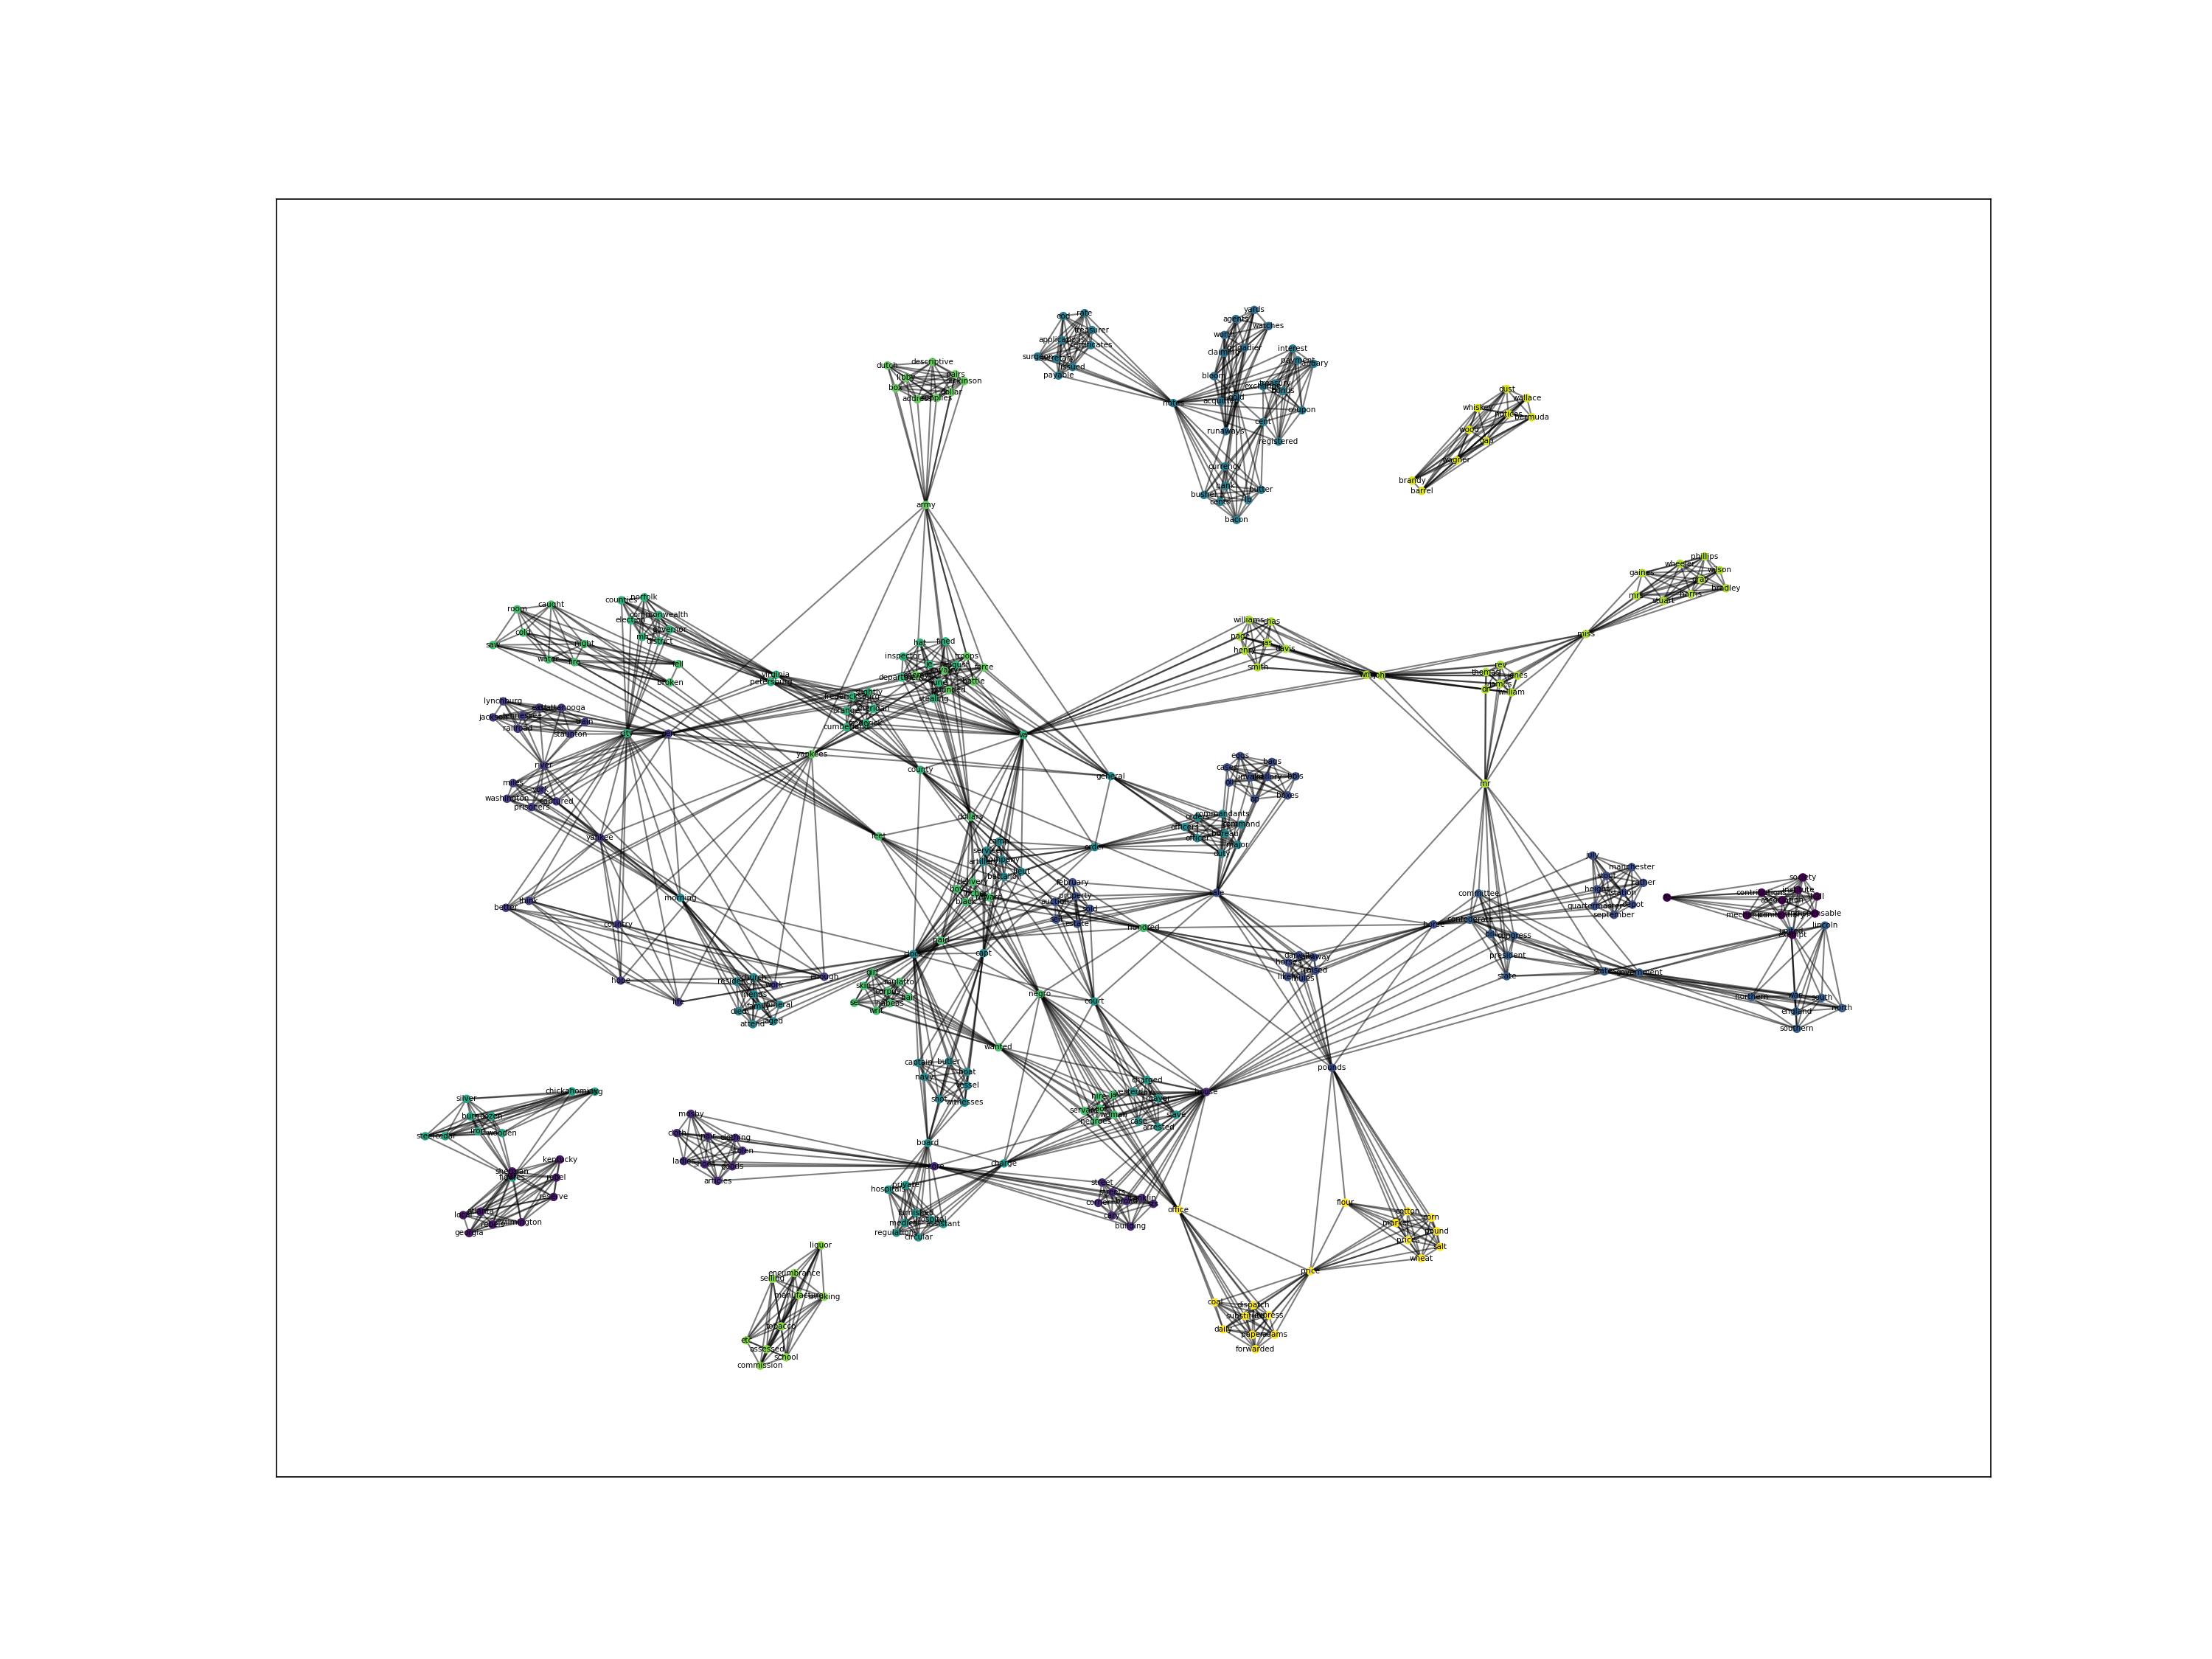
- the link is to the “RAW” TSV file with the following columns: topic, term, and term’s probability. The network can be generated from this data: nodes are terms; edges are co-occurence of terms in the same topic; weights can be derived from probabilities of terms.
- this is the converted data
13.5 Scripts
13.6 Graphs
13.7 Homework
- Finish the assigned task;
- Annotate your script (i.e., add comment to every line of code describing what is happenning there);
Submitting homework:
- Homework assignment must be submitted by the beginning of the next class;
- Now, that you know how to use GitHub, you will be submitting your homework pushing it to github:
- Create a relevant subfolder in your repository and place your HW files there; push them to your GitHub account;
- Email me the link to your repository with a short message (Something like: I have completed homework for Lesson 3, which is uploaded to my repository … in subfolder
L03)
- Email me the link to your repository with a short message (Something like: I have completed homework for Lesson 3, which is uploaded to my repository … in subfolder
- Create a relevant subfolder in your repository and place your HW files there; push them to your GitHub account;
13.8 Solution
Below is the solution to the homework…